 ">
">
The 2023 Appalachian Trail Thru-Hiker Survey: General Information Part 1
The 2023 Appalachian Trail Hiker Survey is here! This year we’ve added a lot of questions, mostly about the experience aspect of the hike and safety. As such, we’ve also broken the first general information post into two parts. This first post will largely include demographics and logistics, while the next post will focus more on the experiences during the hike and hiker favorites. As always, after the general information posts, we’ll release multiple follow-ups all about gear, so stay tuned.
We had a total of 409 responses this year. Thank you to everyone who filled out the survey! The data was collected from October through November of 2023 through our survey which was marketed using our social media platforms, Backpacker Radio, and TheTrek.co. Some responses from previous years were removed, and obvious mistakes in start and end dates were adjusted. No obvious duplicates were found.
With all that said, let’s get the ball rolling!
READ NEXT —
- The 2022 AT Thru-Hiker Survey: General Information
- The Appalachian Trail Thru-Hiker Survey (All Years)
Demographics
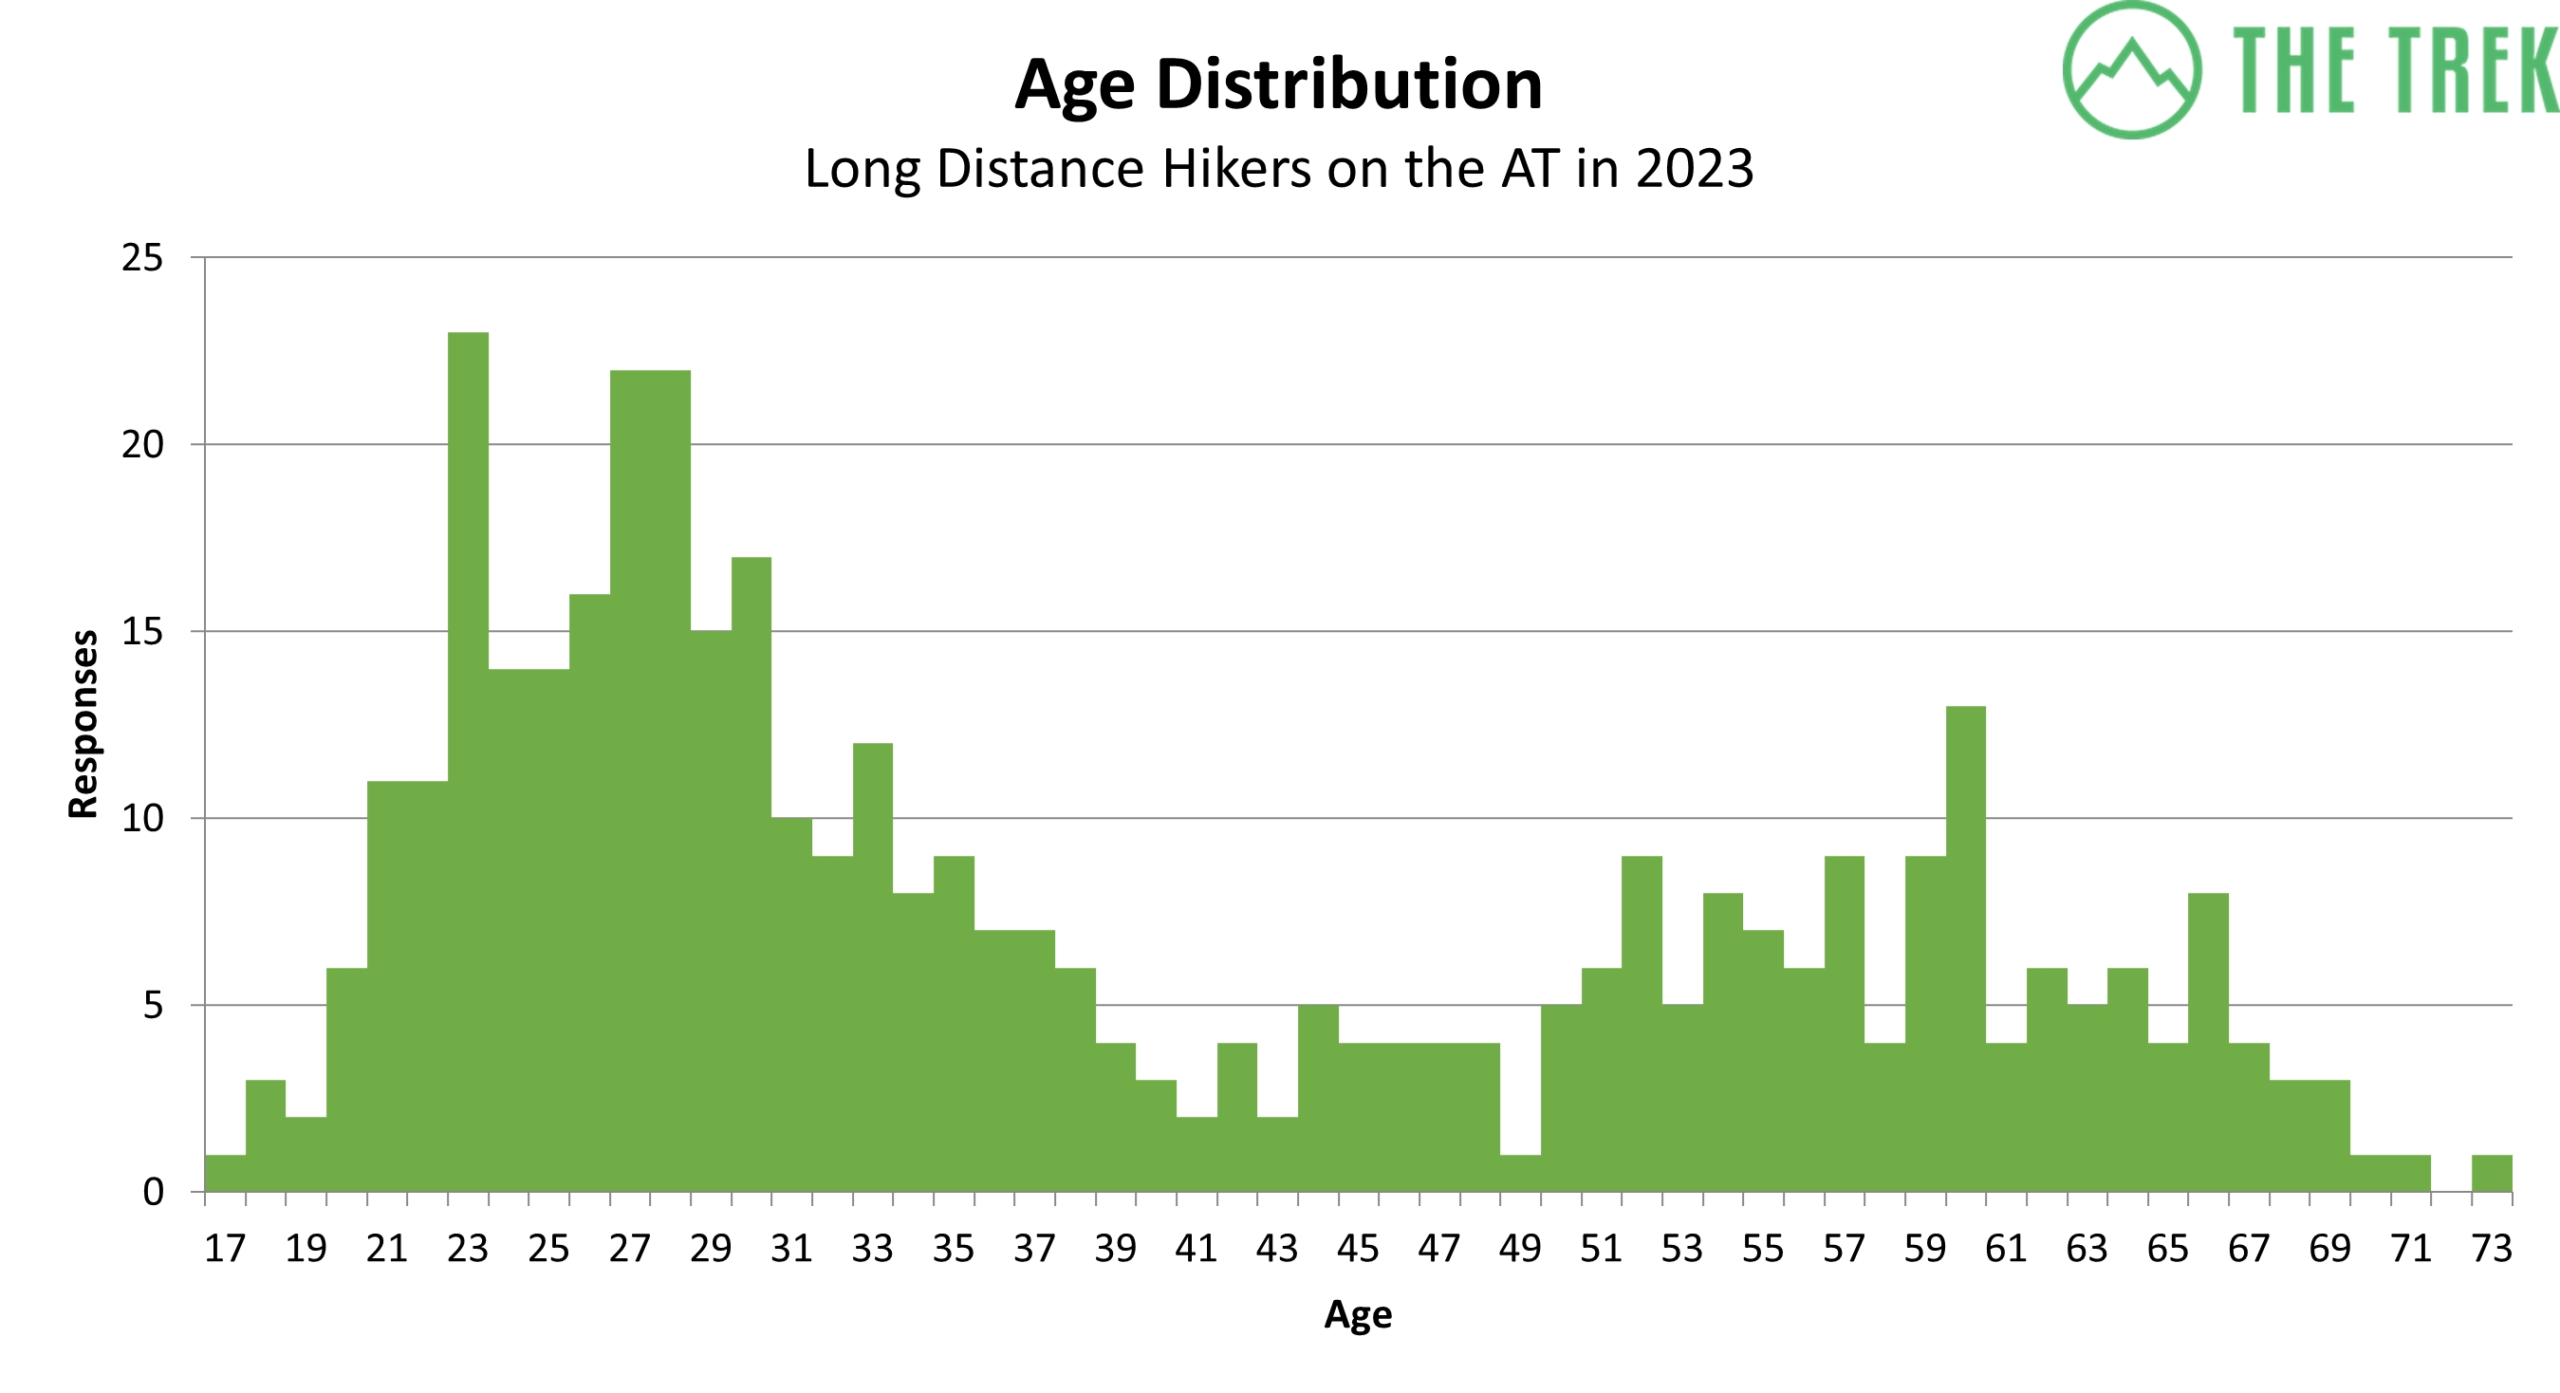
| Minimum | 17 |
| Maximum | 73 |
| Average | 39 |
| Mode | 23 |
| Median | 33 |
The ages of hikers were very similar to those of previous years. None of the statistics in the table above deviated by more than 2 years from the past couple of years that this survey has existed. As is typical, the average age is much higher than the mode due to the wide range of hiker age. The largest group of hikers is under 30, but there is also a peak corresponding to those in their late 50’s and early 60’s as well. This likely represents the periods in life where most people have time to complete a thru-hike: after college and post-retirement.
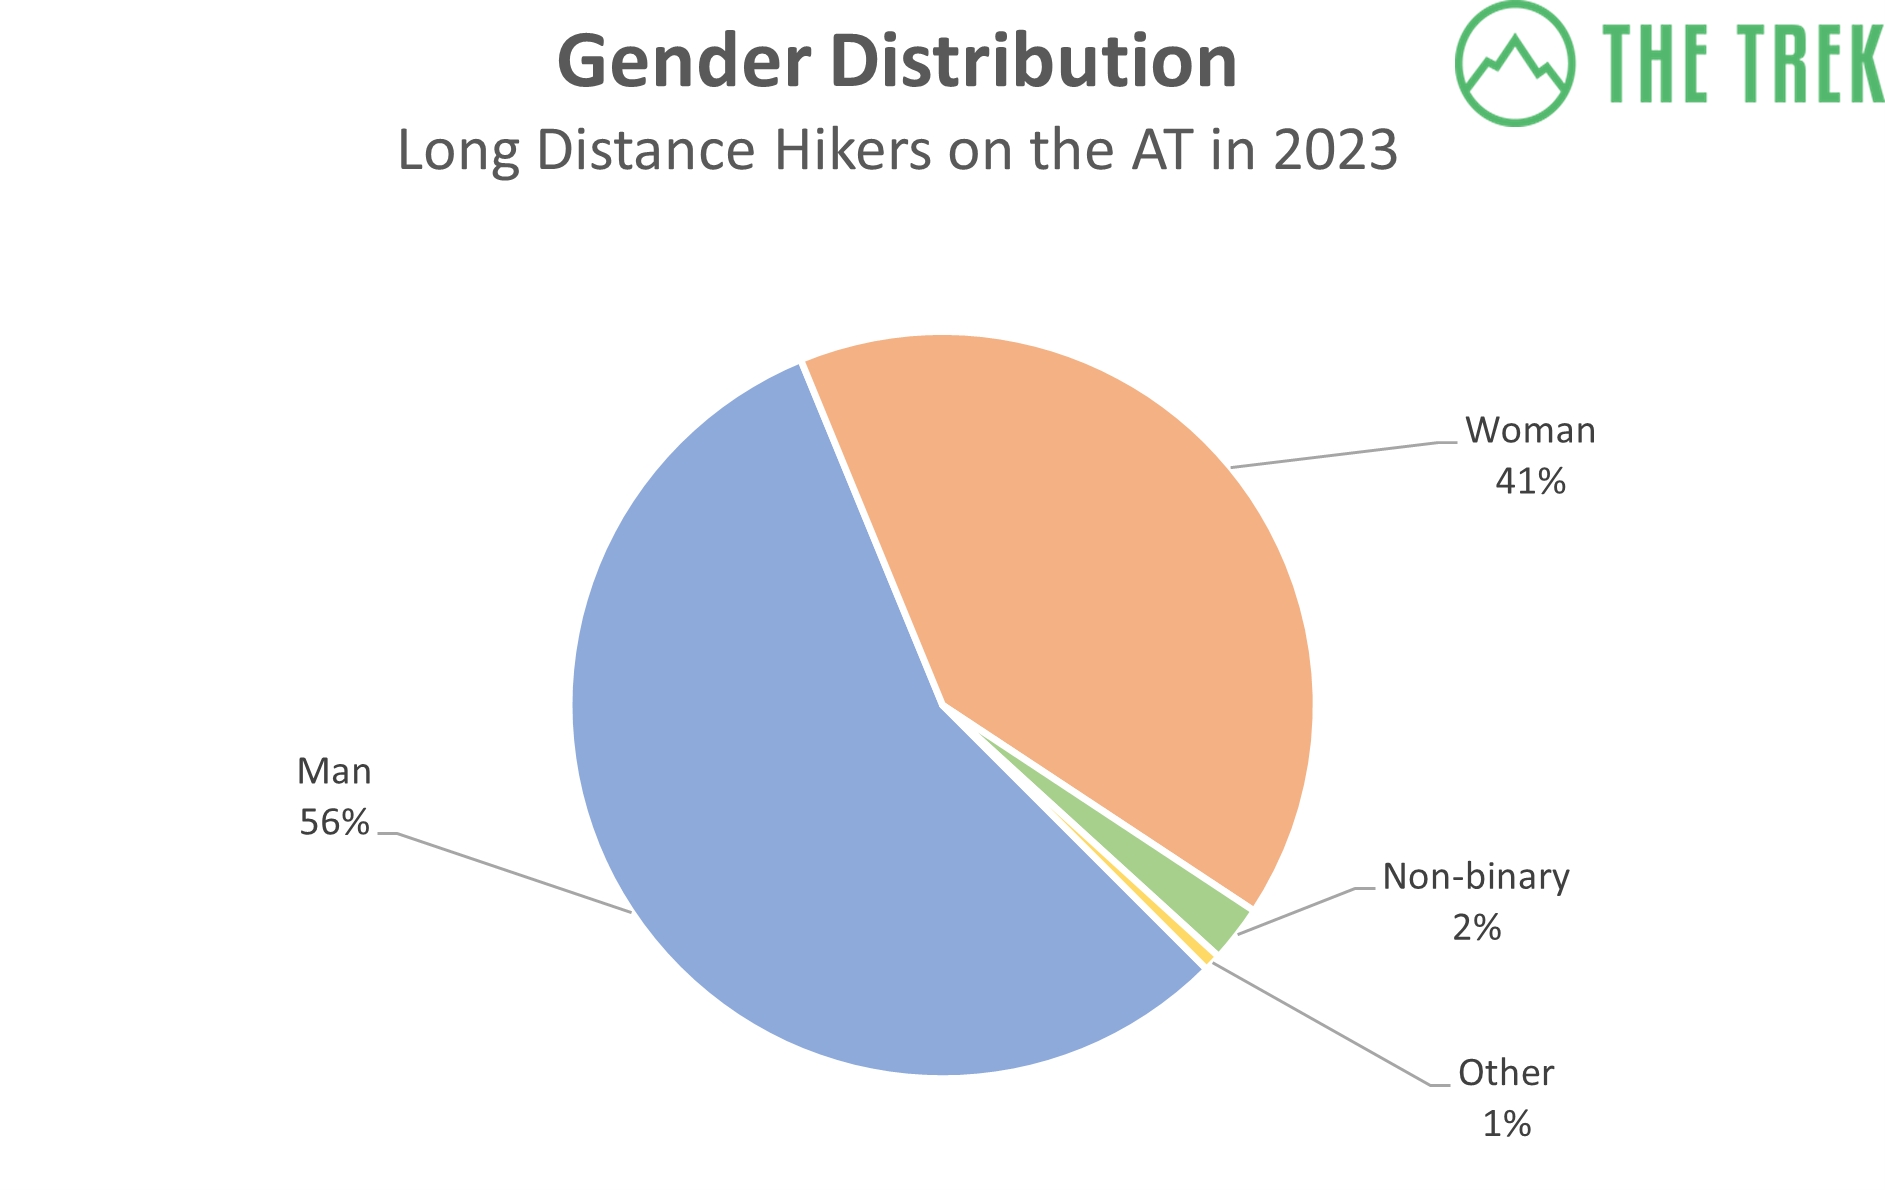
We asked hikers about their biological sex and gender. 57.5% were biologically male, and 42.5% were biologically female, with the results for gender above. The numbers are very close to last year’s results, with slightly fewer women (41% vs 42.5%).
| Race | Respondents |
|---|---|
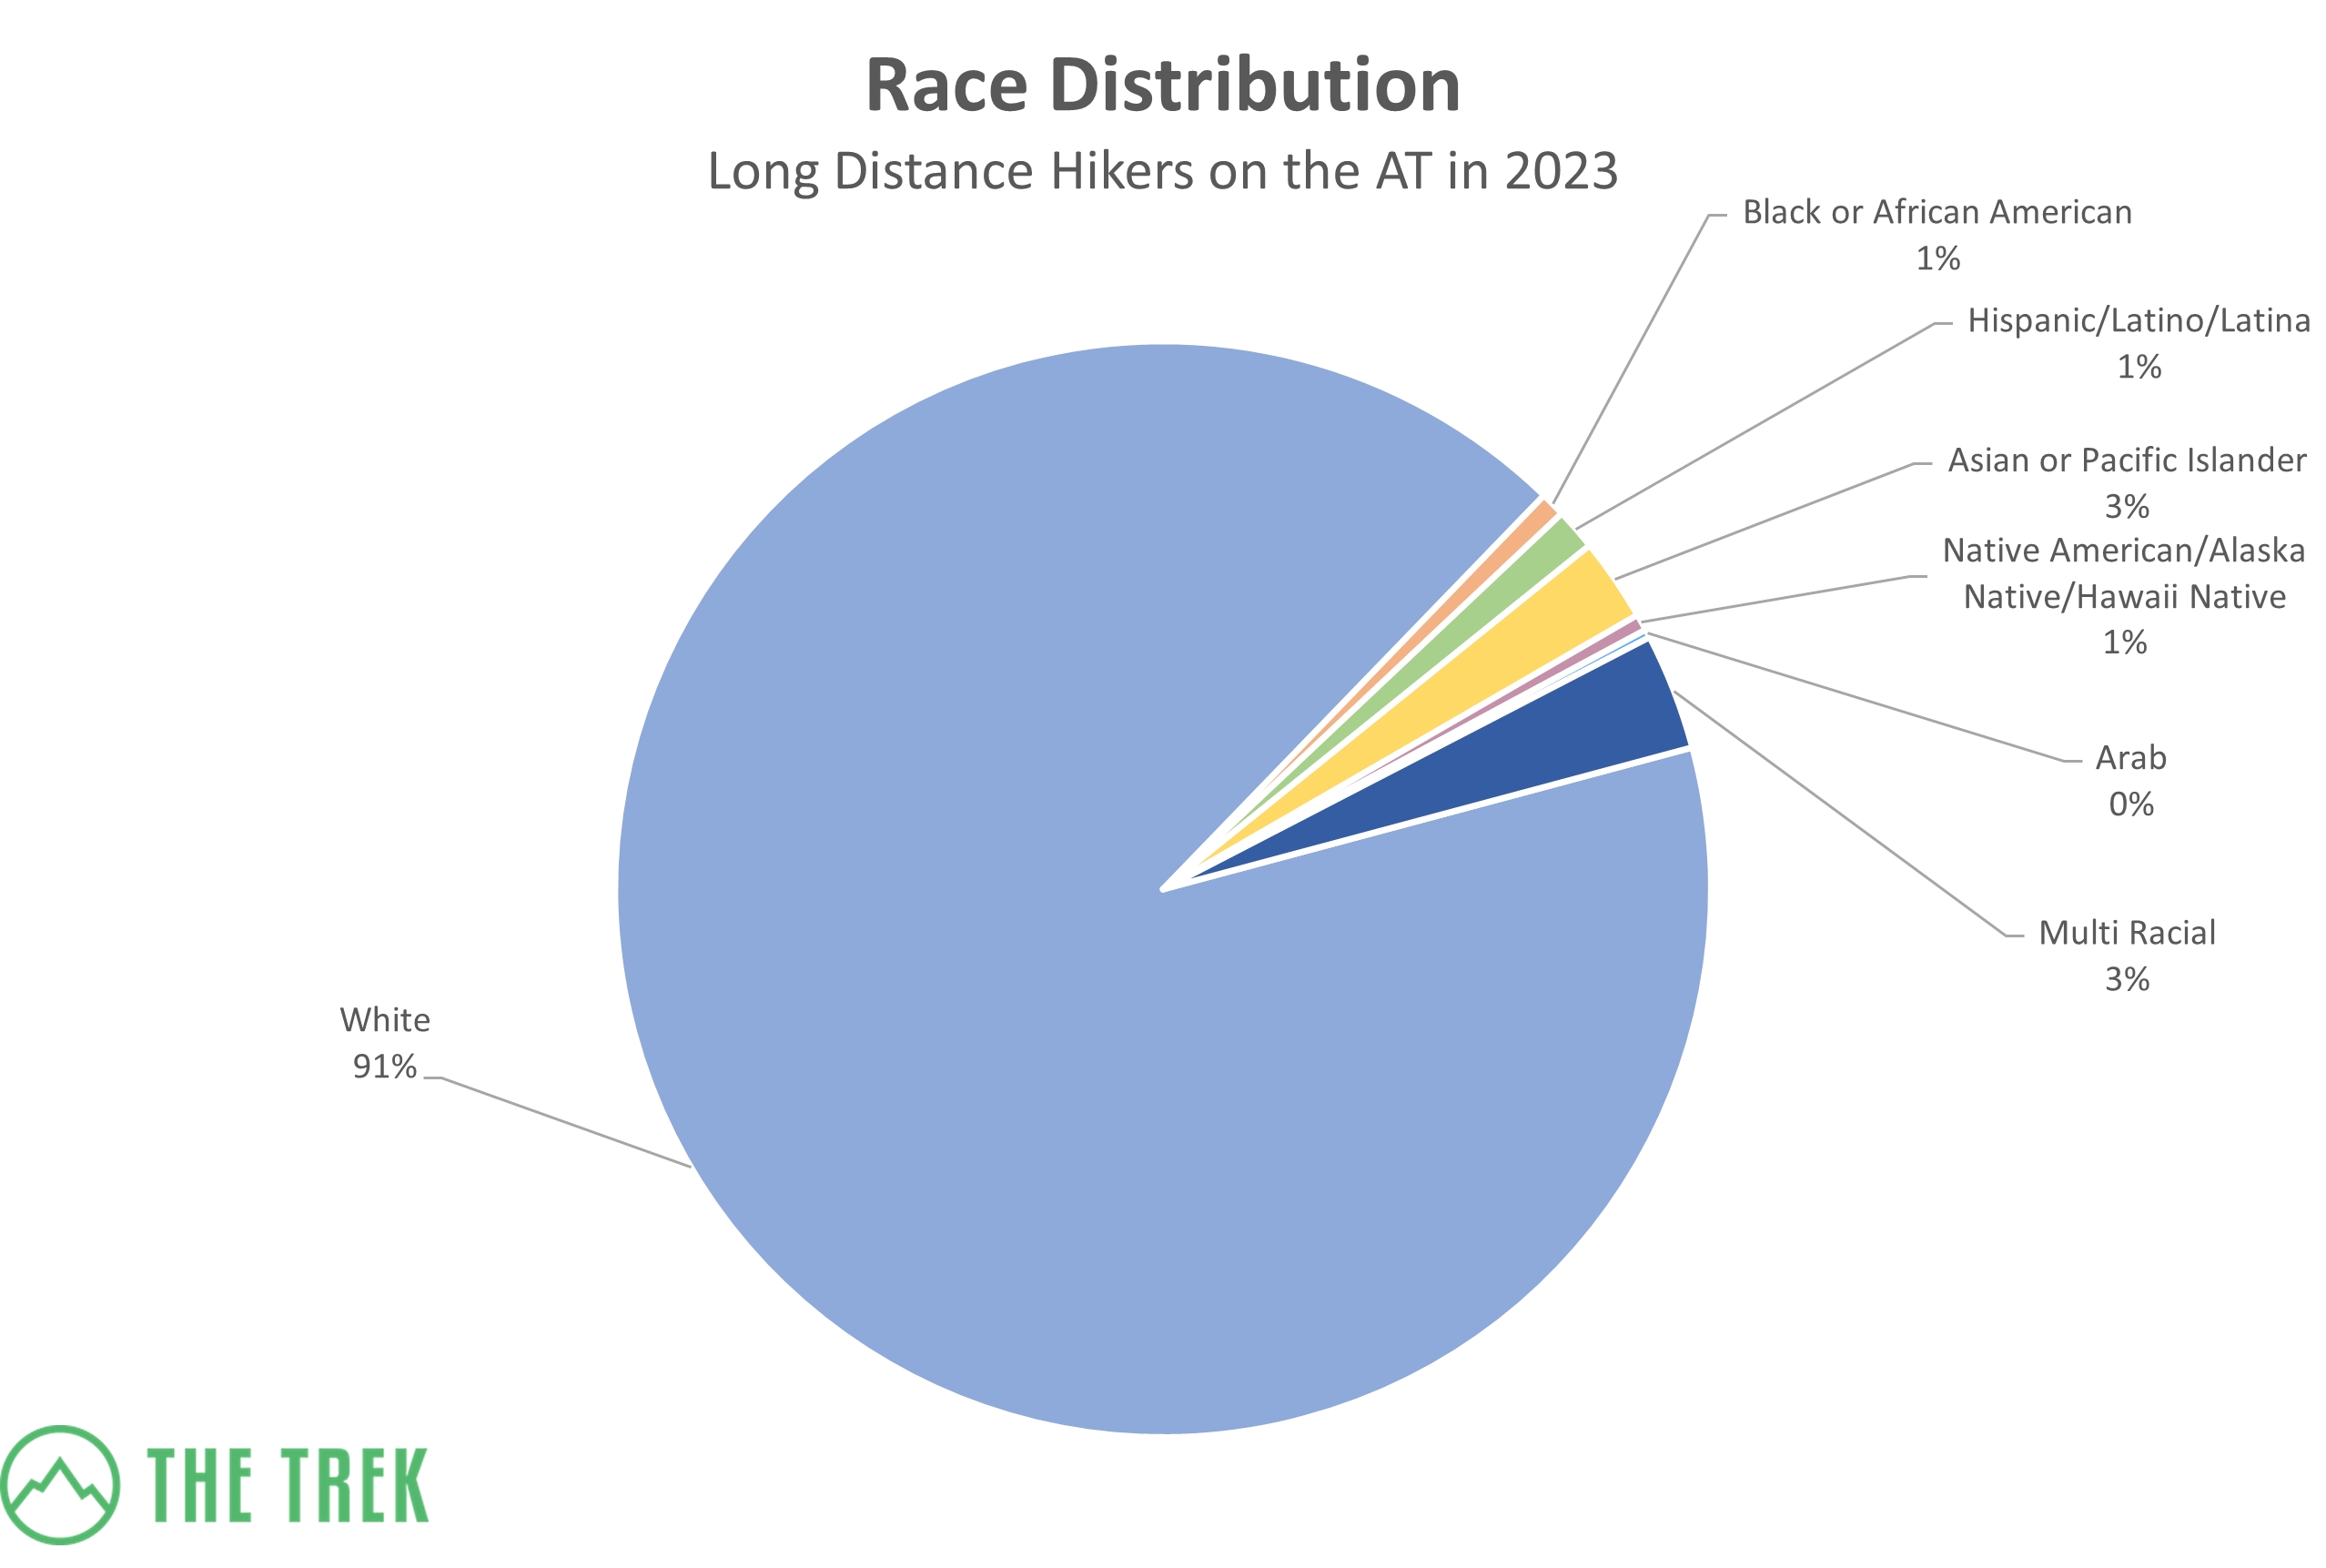
| White | 372 |
| Black or African American | 3 |
| Hispanic/Latino/Latina | 5 |
| Asian or Pacific Islander | 10 |
| Native American/Alaska Native/Hawaii Native | 2 |
| Arab | 1 |
| Multi Racial | 14 |
The racial distribution was also similar to previous years’ results, with the overwhelming majority of hikers identifying as White. There was a slight percentage decrease in White hikers from last year, 93% to 91%.
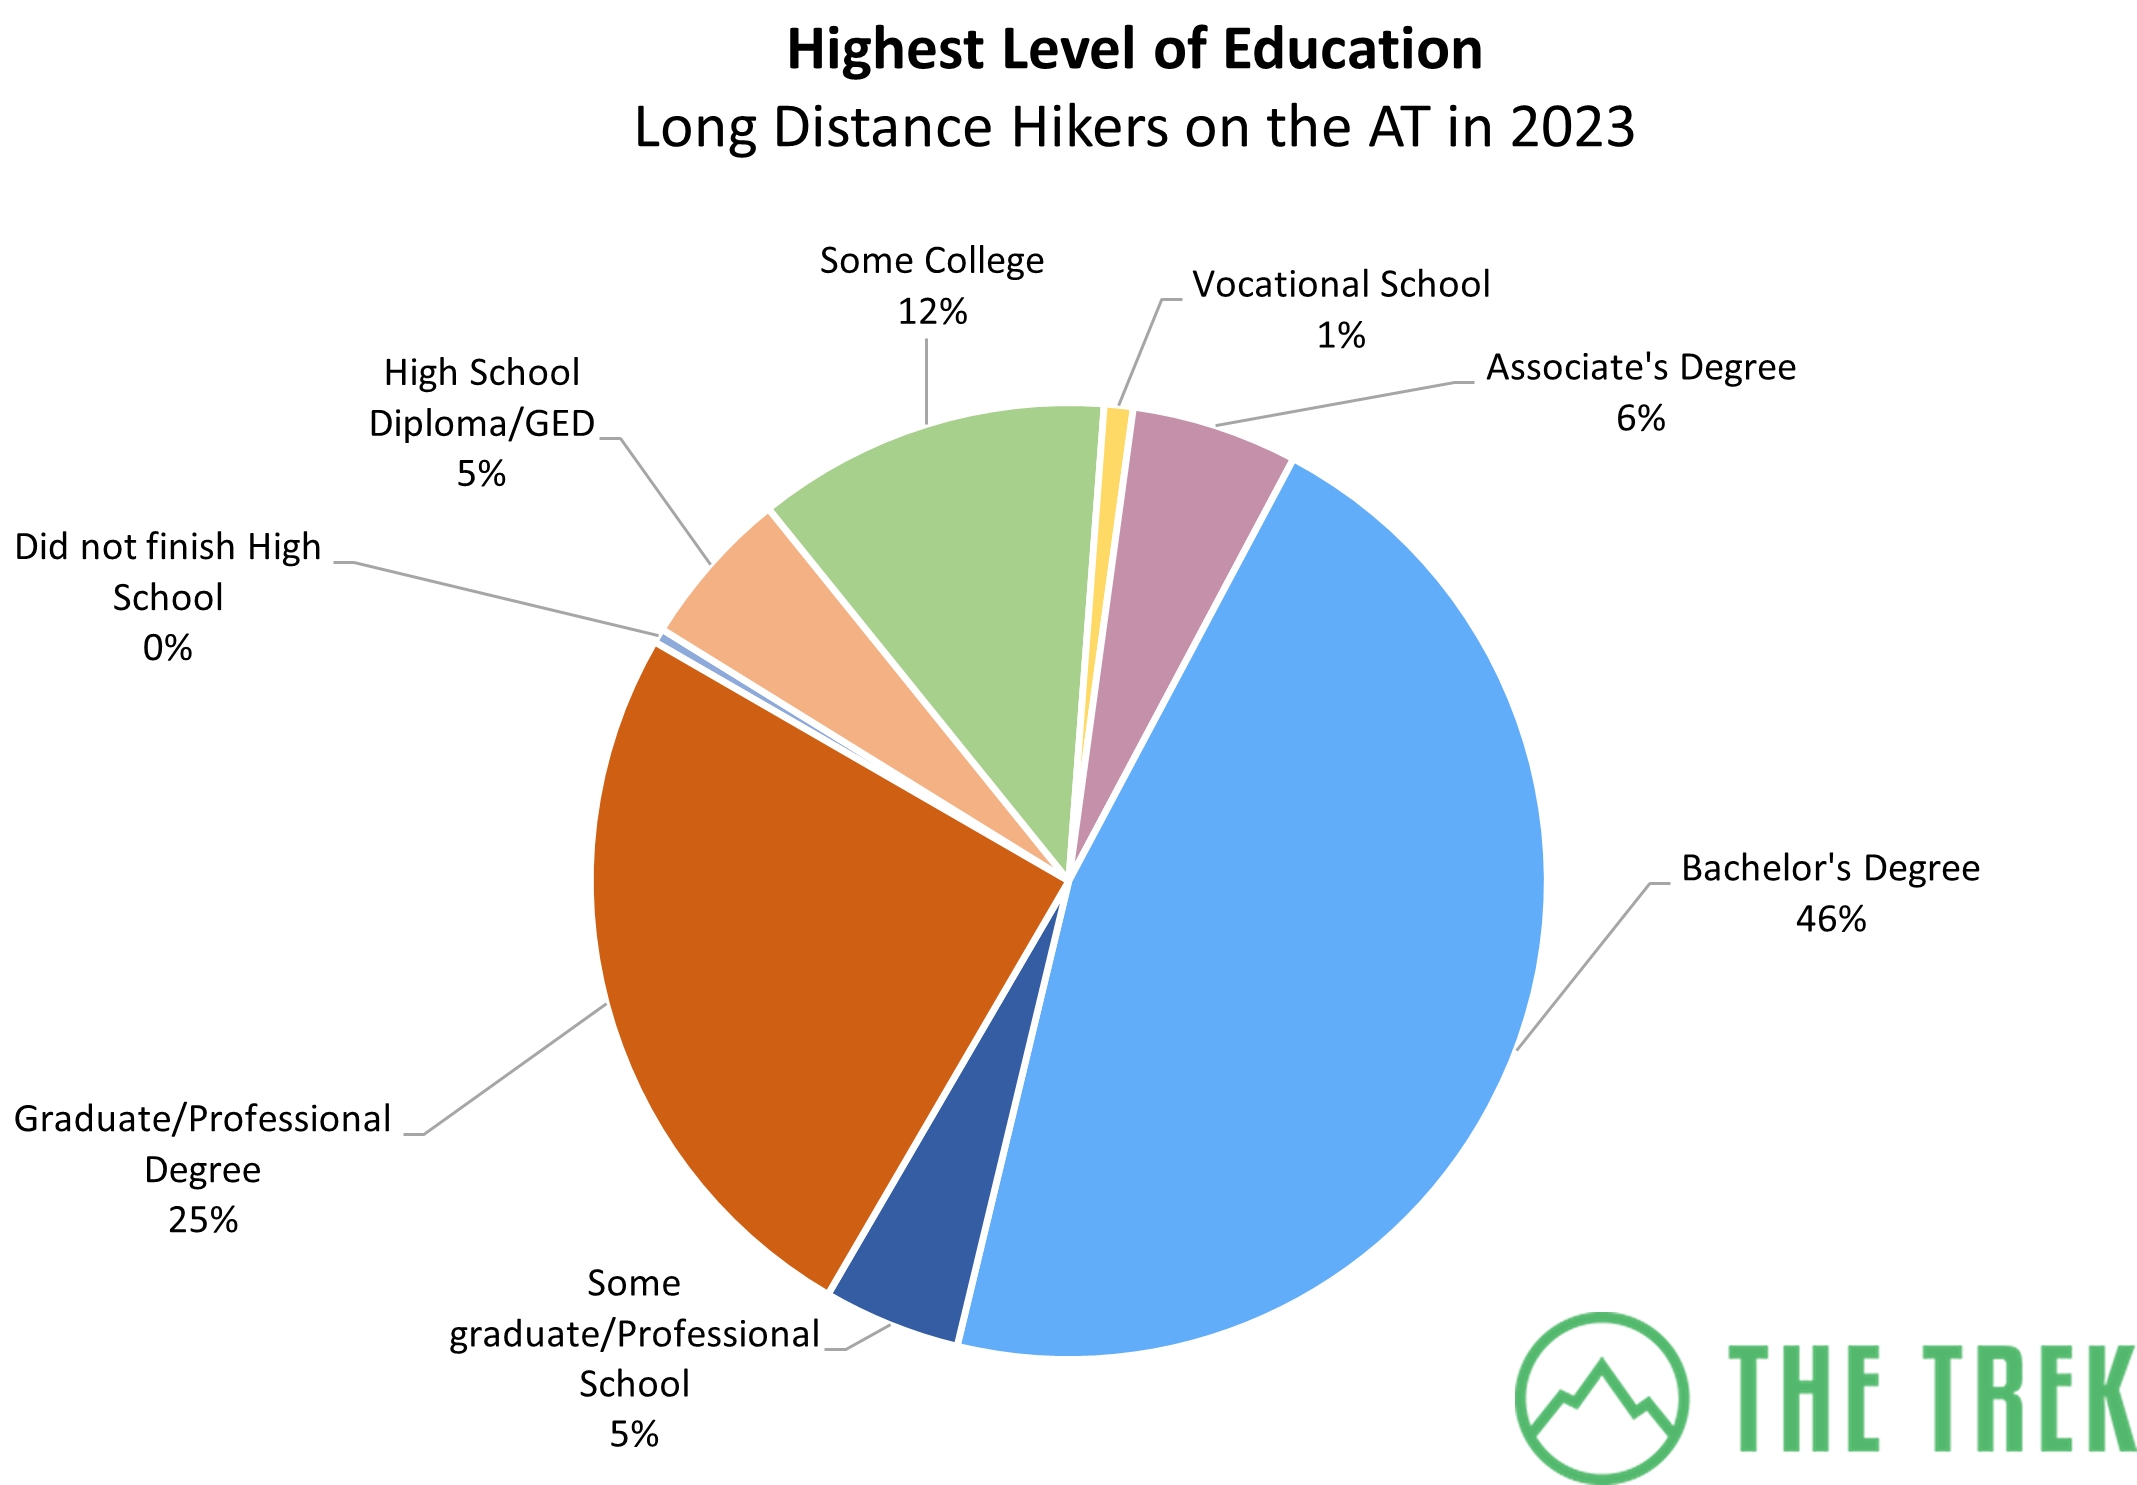
The level of education hikers had has also hardly changed from last year, with no categories changing by more than 2%. Most hikers are college-educated, but it is also useful to keep in mind that 14% are 22 or under and may not have yet acquired a degree due to their age.
90% of hikers were from the United States this year. The majority of hikers came from the East Coast as seen on the map. This is typical of previous years as well. North Carolina had the highest number of hikers with 30, closely followed by Virginia and Pennsylvania, respectively.
The distribution of countries hikers are from is shown below. Countries in the “Other” category include Norway, Australia, Sweden, Belgium, Russia, the Netherlands, Denmark, and South Africa with two or fewer hikers each.
| Country | Respondents |
|---|---|
| United States | 371 |
| Canada | 10 |
| Germany | 6 |
| England | 9 |
| Switzerland | 3 |
| Other | 10 |
Hiking Basics
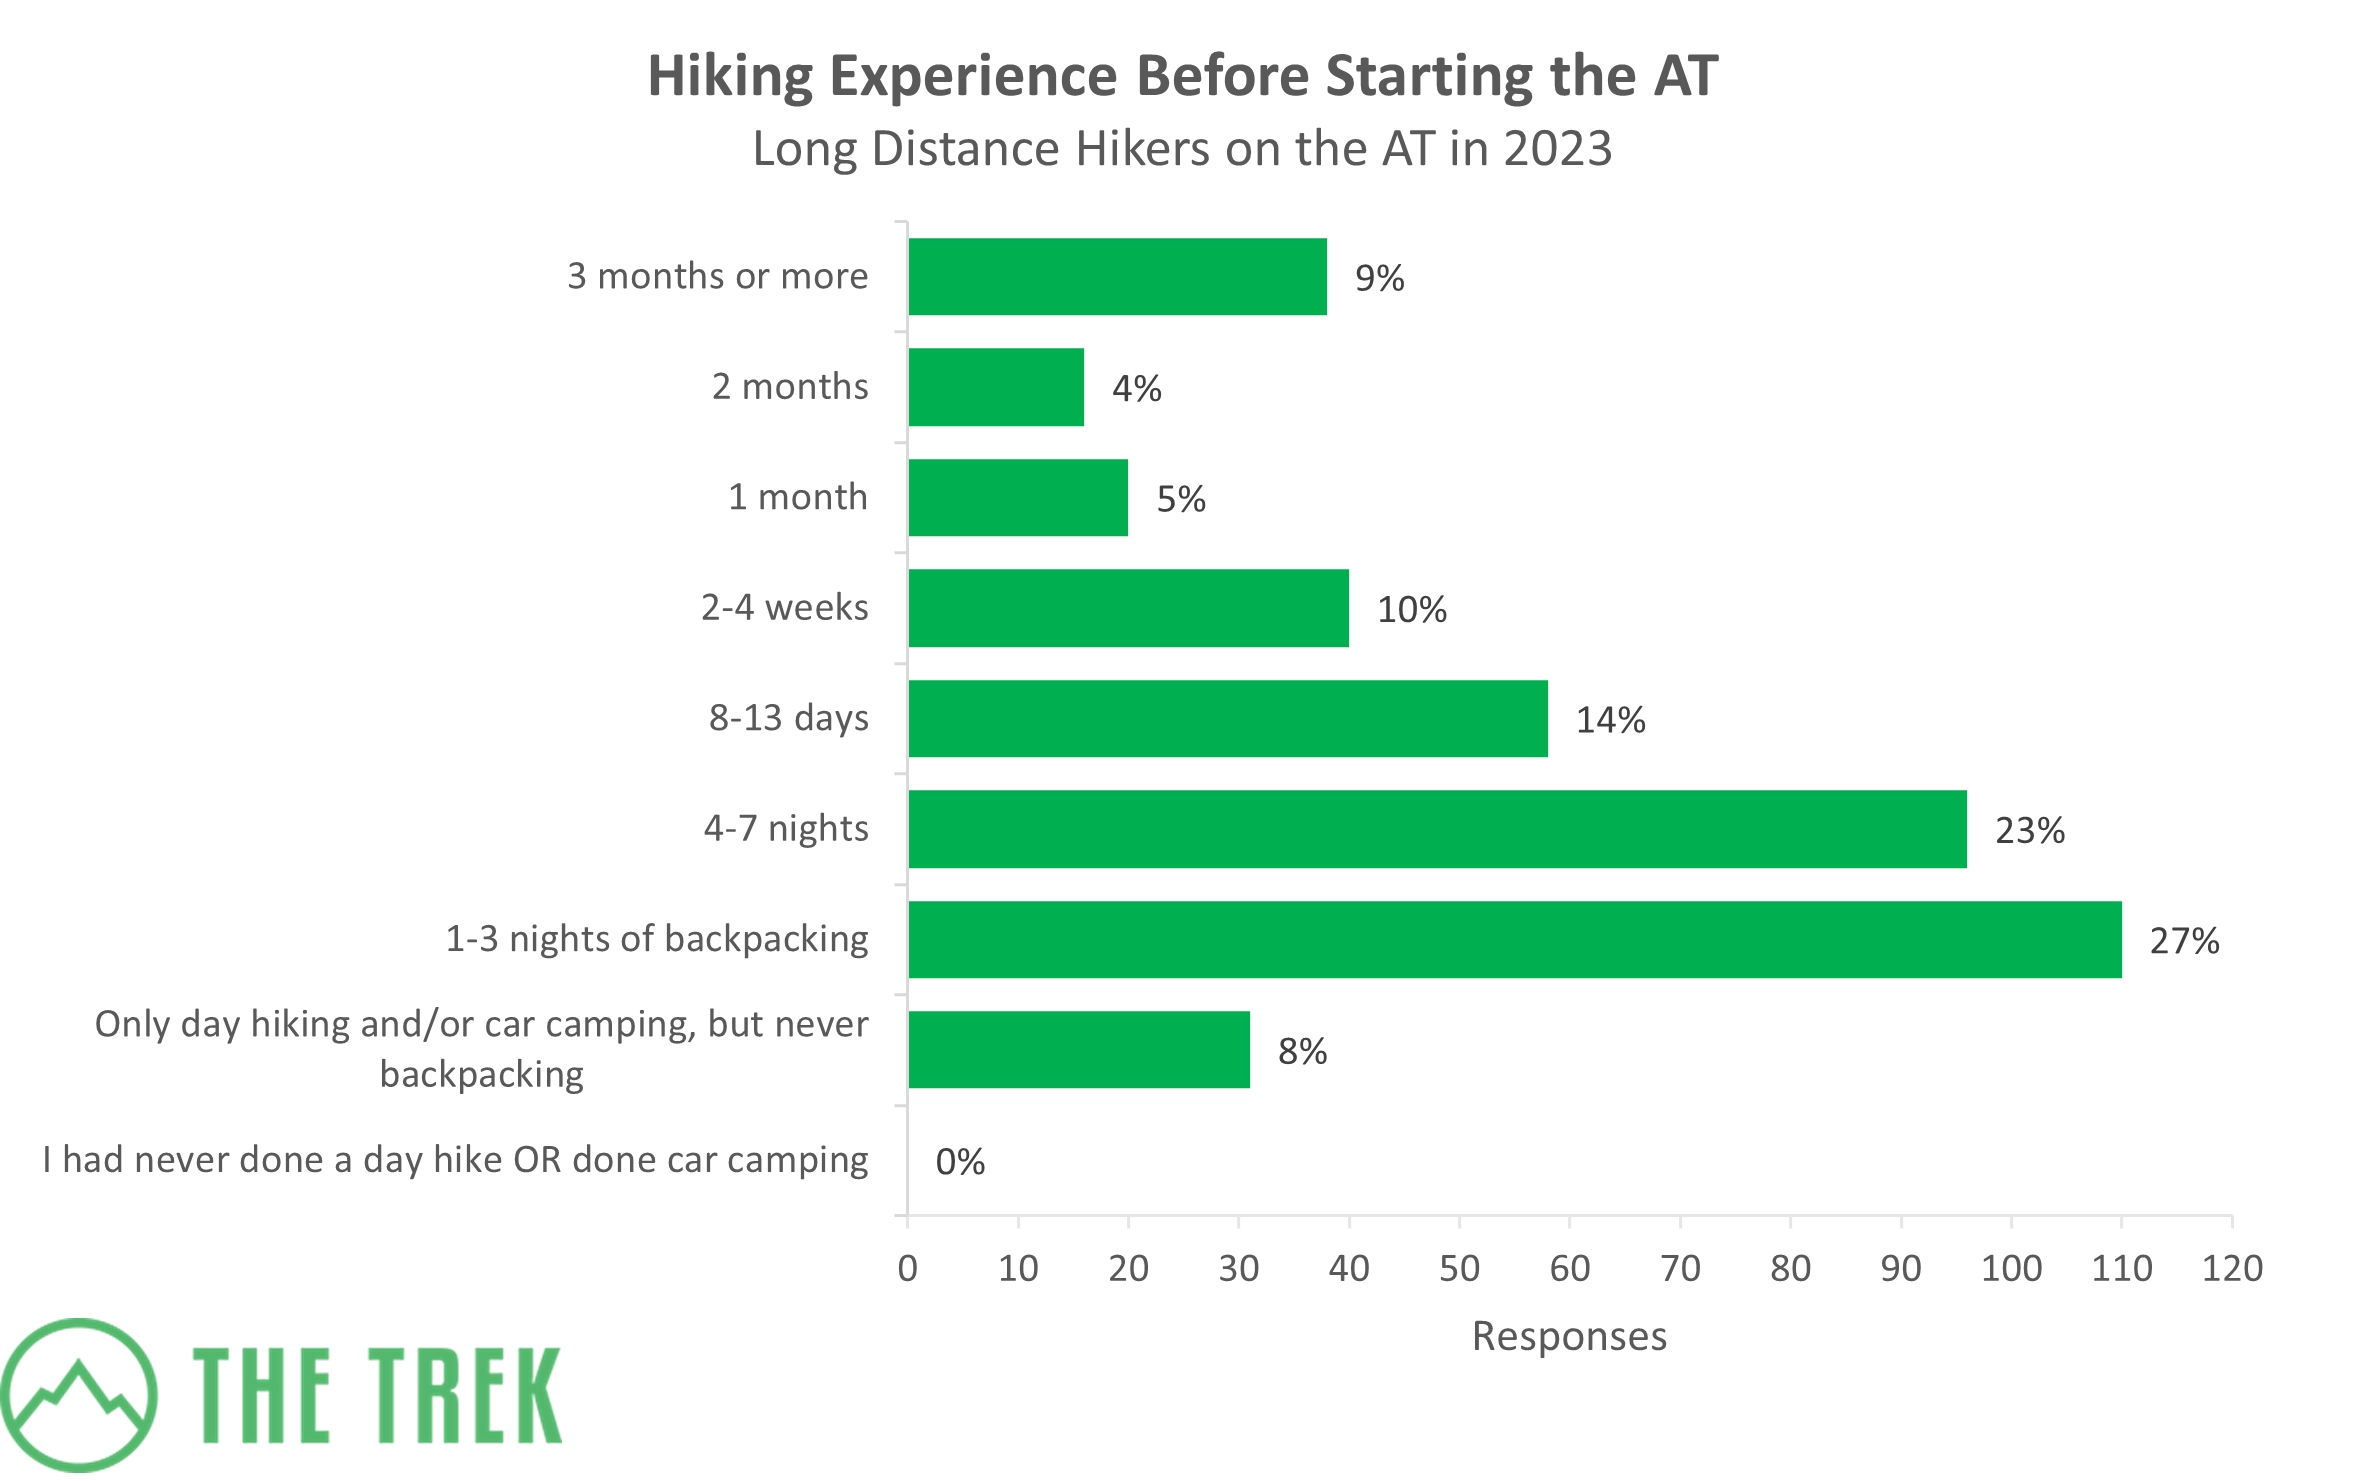
Over 50% of hikers backpacked between 1 and 7 nights prior to their thru-hike. 9% had 3 months or more of prior backpacking experience, which is a sharp jump from 1 and 2 months of experience likely caused by former long-trail thru-hikers. 8% of thru-hikers this year had only day hiked or car camped before starting the AT, but no one had zero experience with hiking in general.
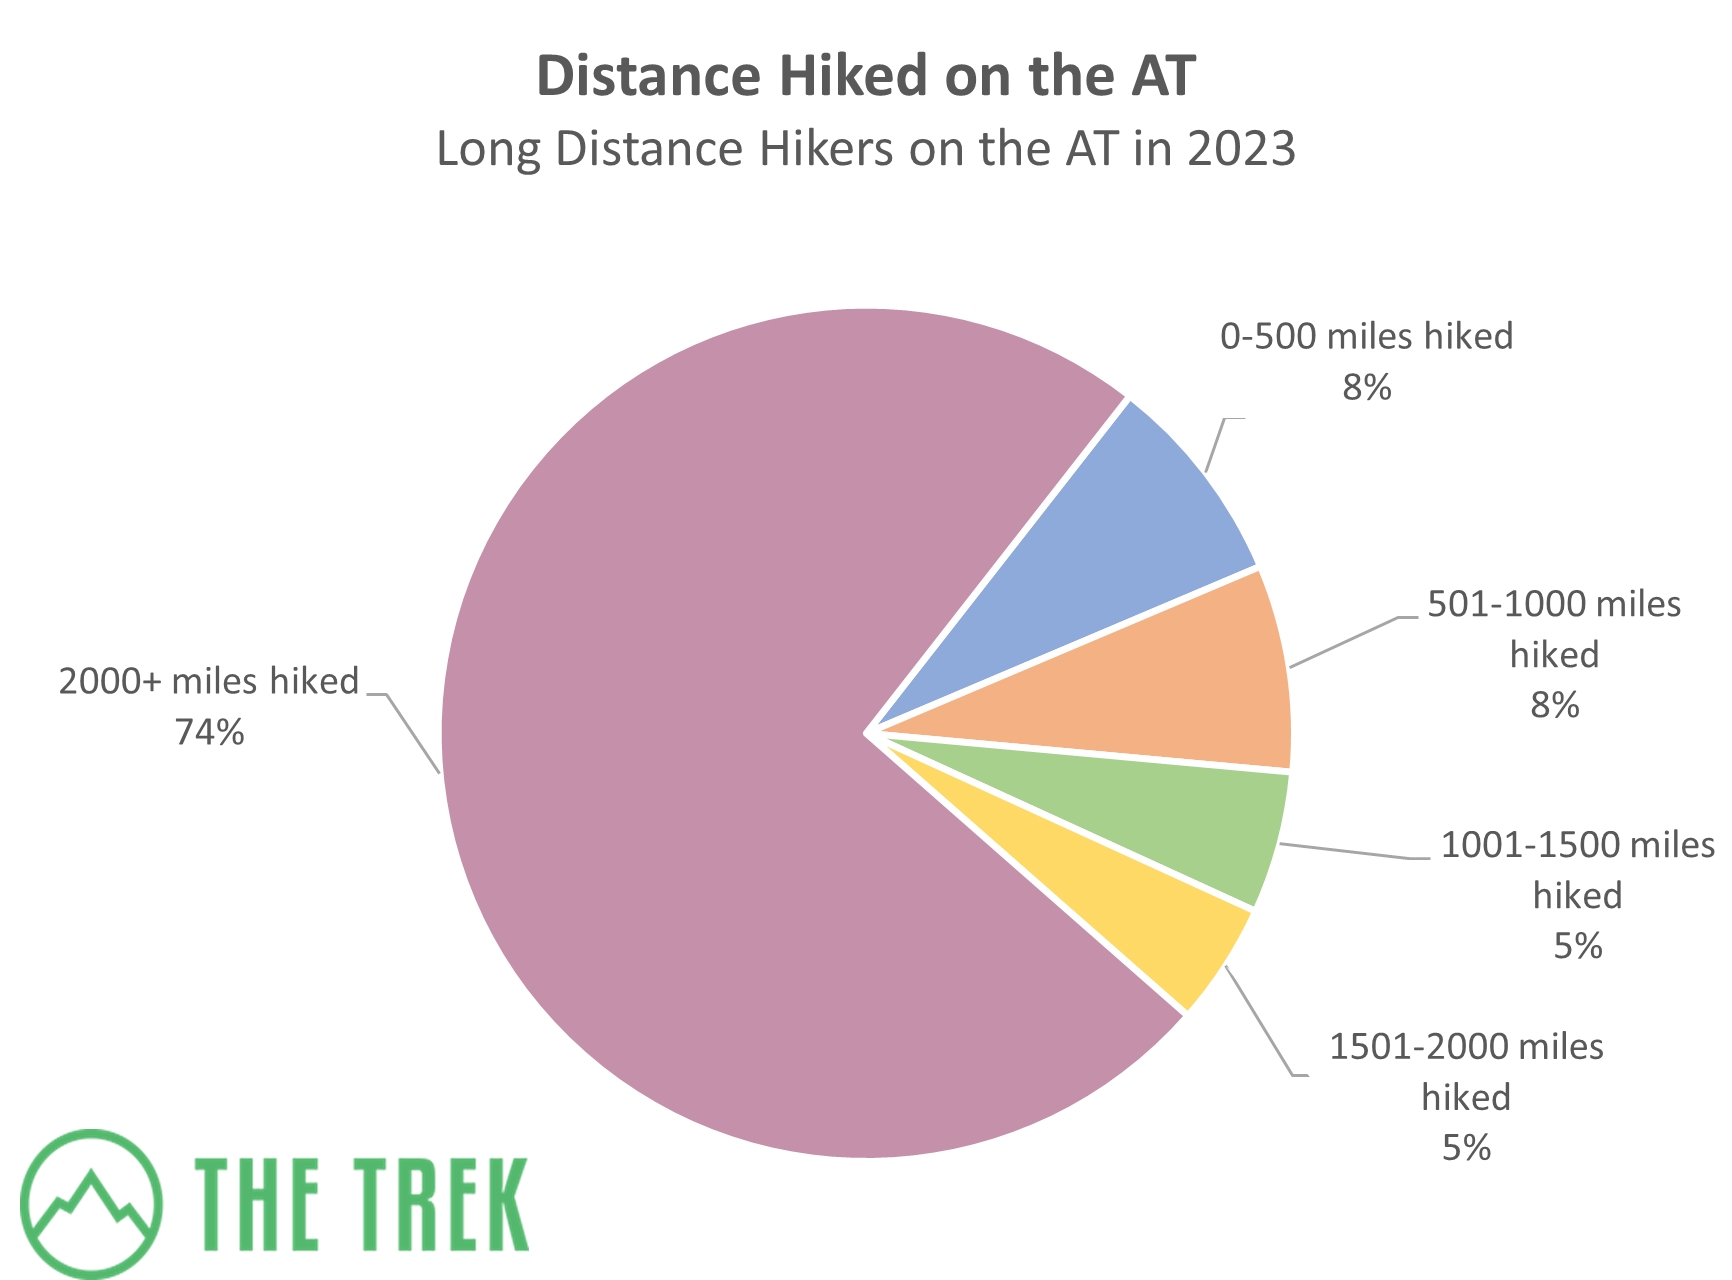
This year, 303 respondents (74%) hiked over 2,000 miles and completed their thru-hike. The ATC typically reports much lower levels of completion, with the 2022 completion percentage being 28-32% depending on direction. The ATC is working with a much larger data set which accounts for the disparity.
This survey and the Trek in general represent the thru-hiking niche more heavily than the general AT population, and as such potentially draw responses from those more committed to their thru-hikes. We also like to think that those familiar with this website/survey are more prepared for the rigors of trail life by being exposed to the wealth of knowledge hosted herein.
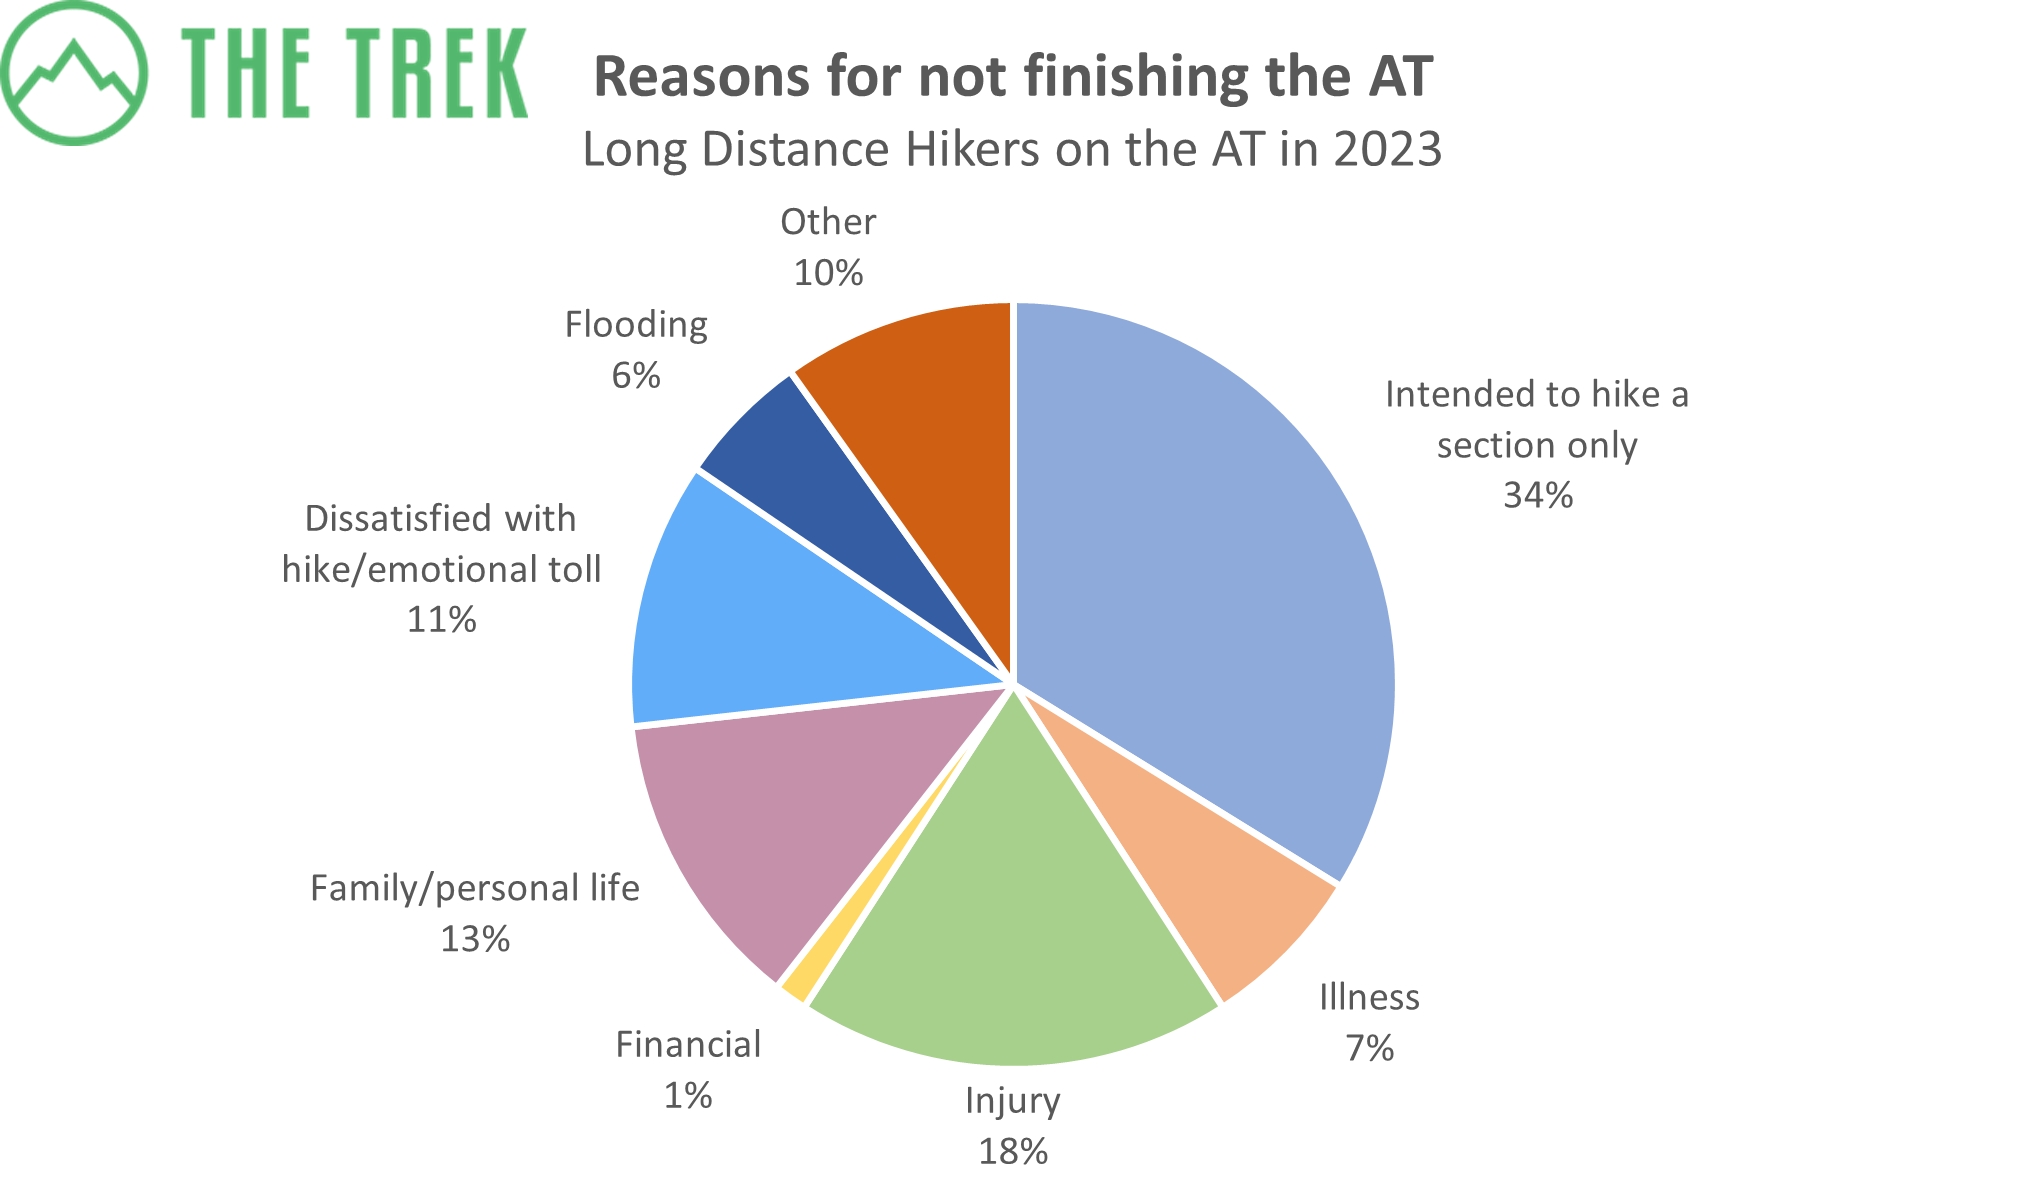
71 hikers did not finish a thru-hike this year, but 24 of them only intended to hike a section. Injury was the most common reason for not finishing a thru-hike, but it was down from last year’s 33% to 18% of hikers claiming injury as the reason for not finishing their hike. A new reason preventing completion was flooding. In New England, there was extreme weather this year that caused quite a lot of problems for hikers. It was so much of a problem that multiple hikers listed it as the reason for not completing their thru-hike.
Timeline
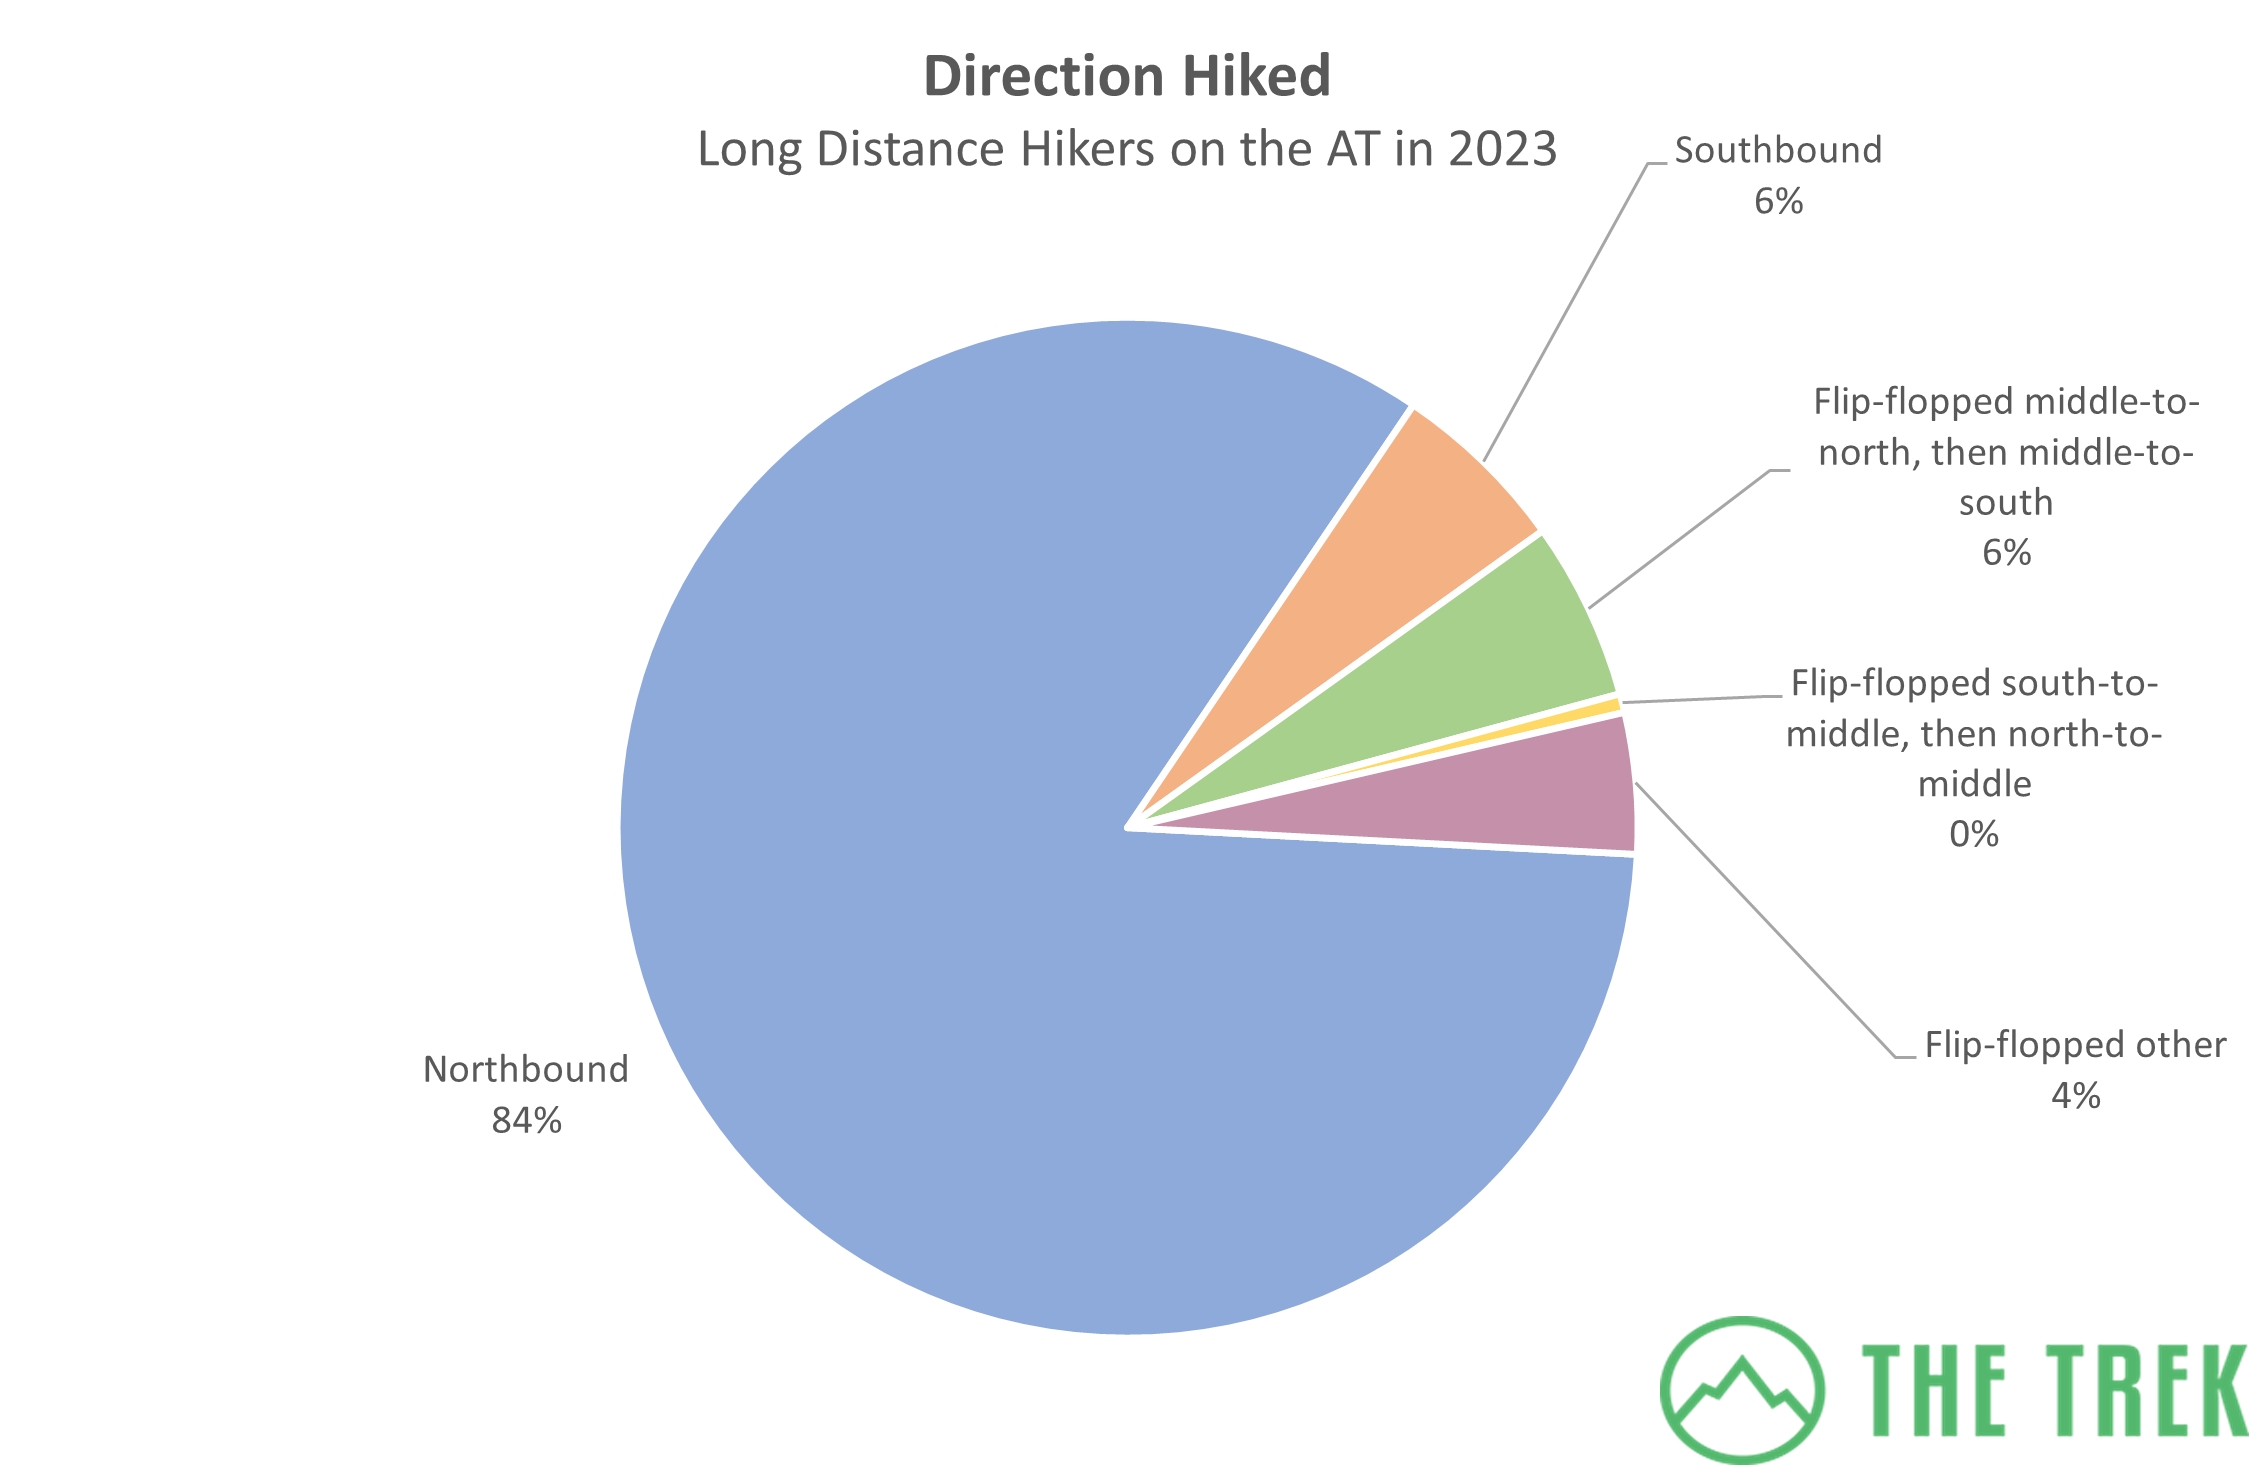
As per usual, Northbound was the most popular hiking direction among respondents. There was a noticeable drop though, with 84% this year to last year’s 91%. Southbound and flip-flop hikers both increased by at least 3% over last year.
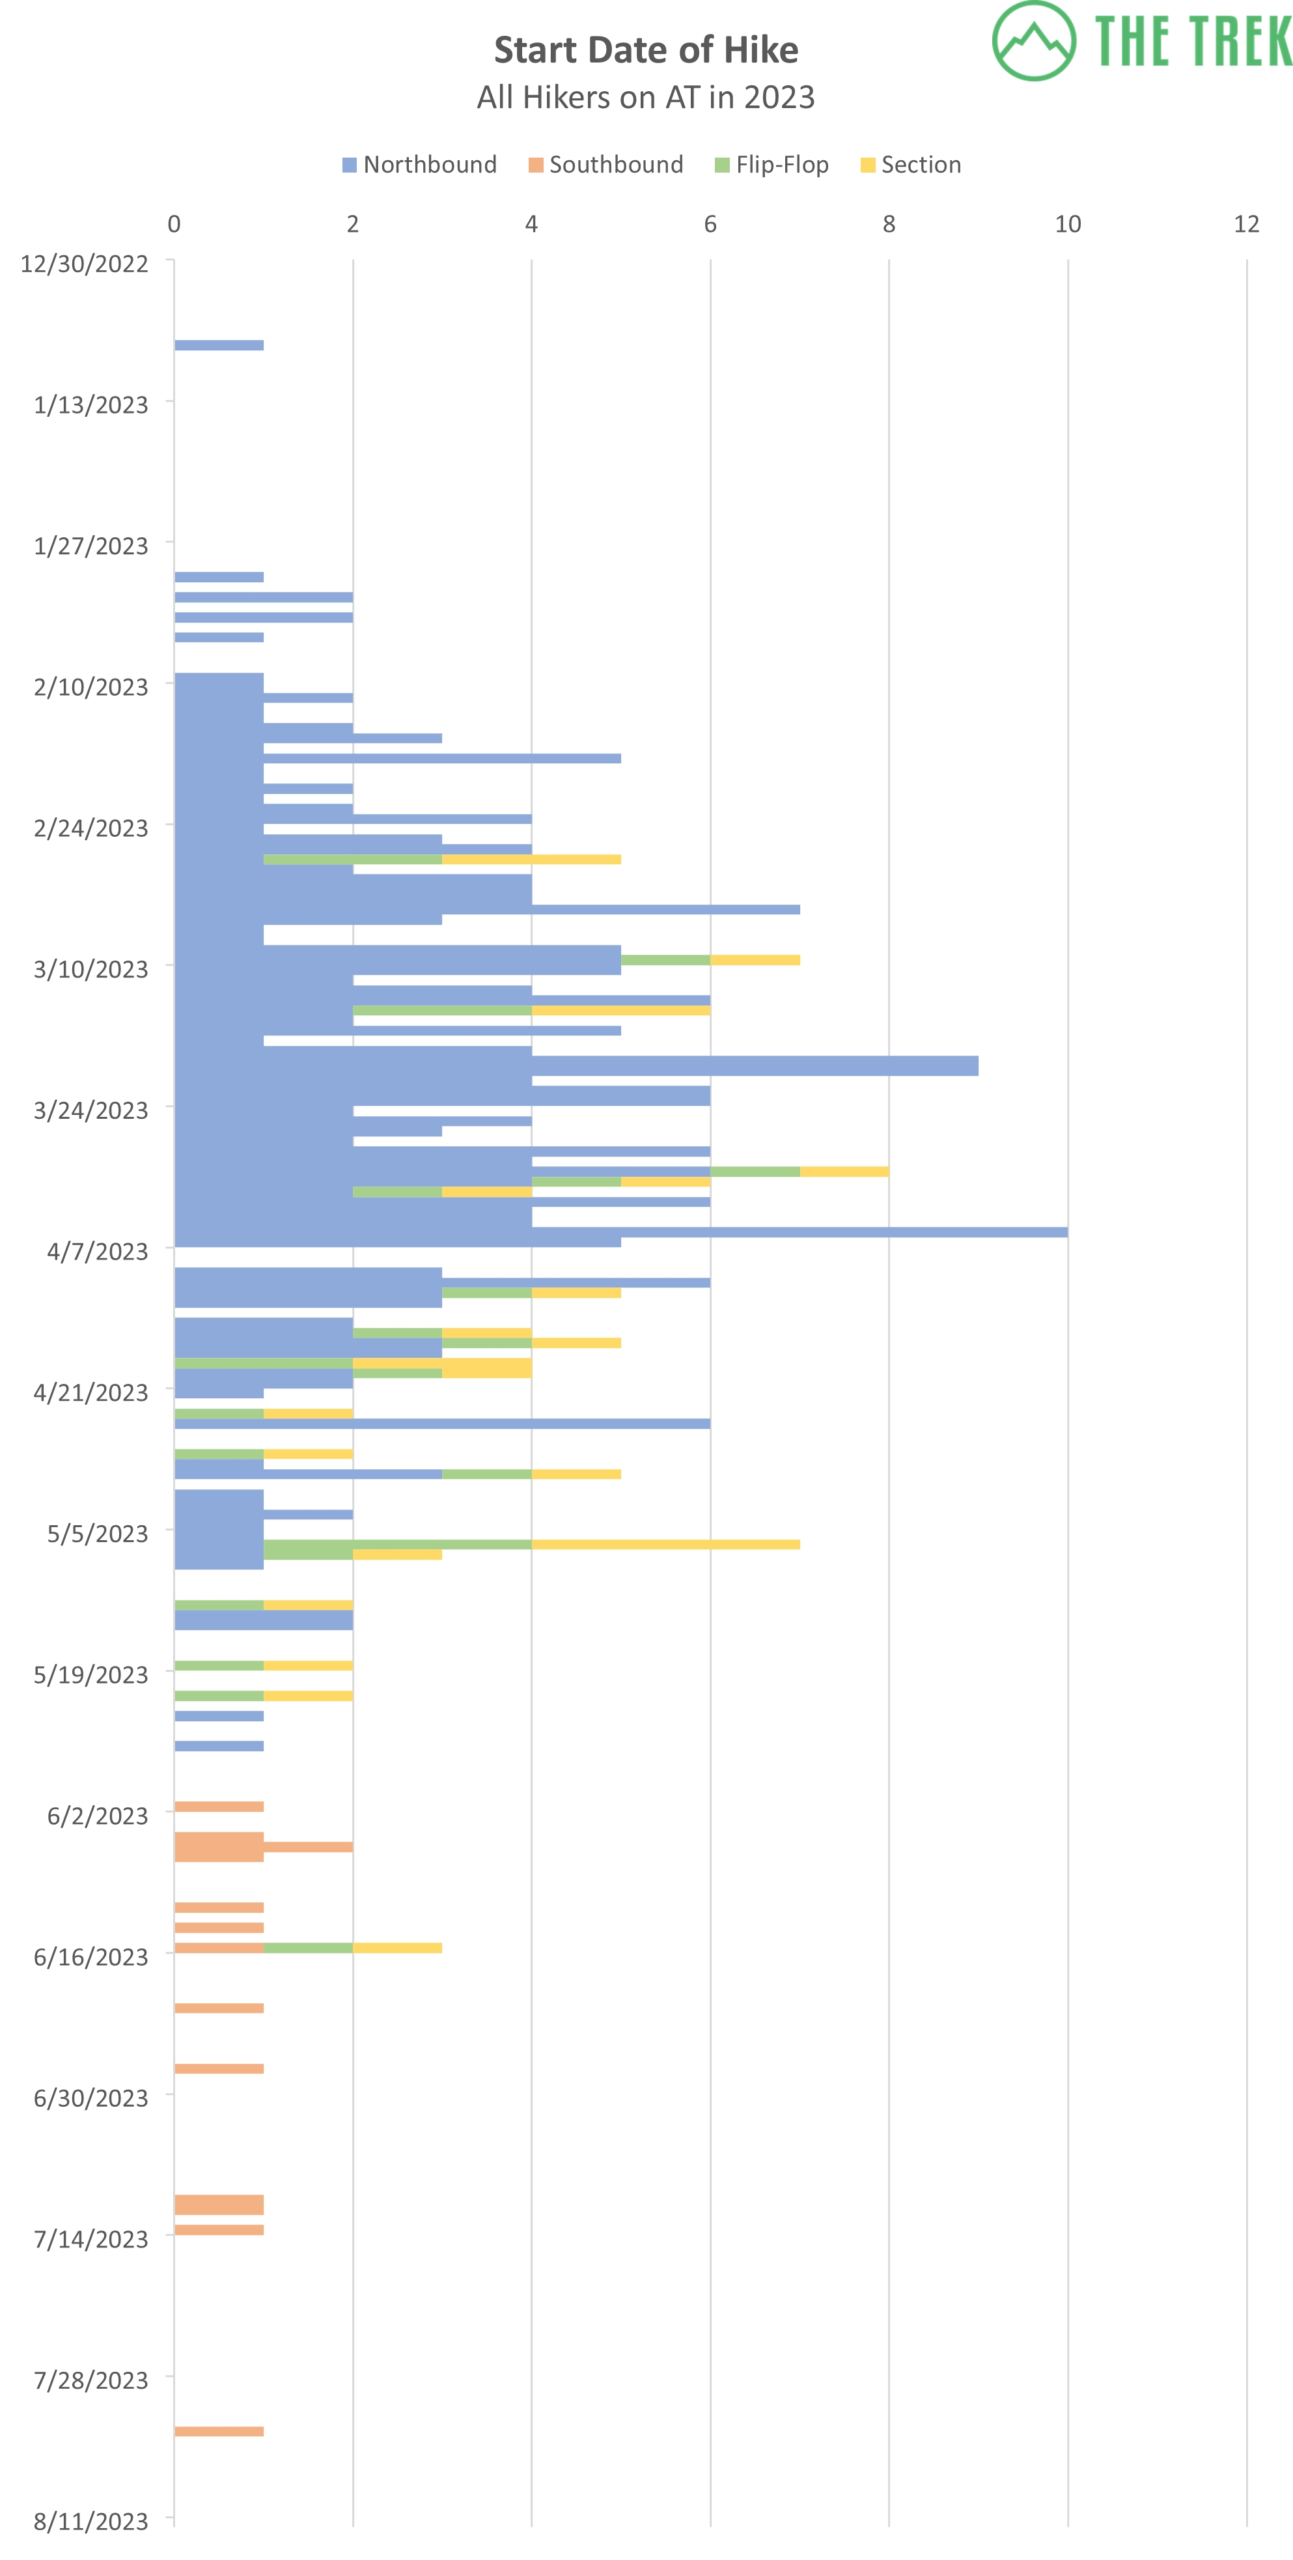
The majority of hikers began in March and April, with April 5 being the most popular start date. The earliest Northbound hiker started on January 7th, and the earliest Southbound hiker started on June 1. Inversely, the latest Northbound hiker started on May 6 and the latest Southbound hiker started on August 2. A married couple who flip-flopped started their hike on September 22 of 2022, and were not included in the chart above.
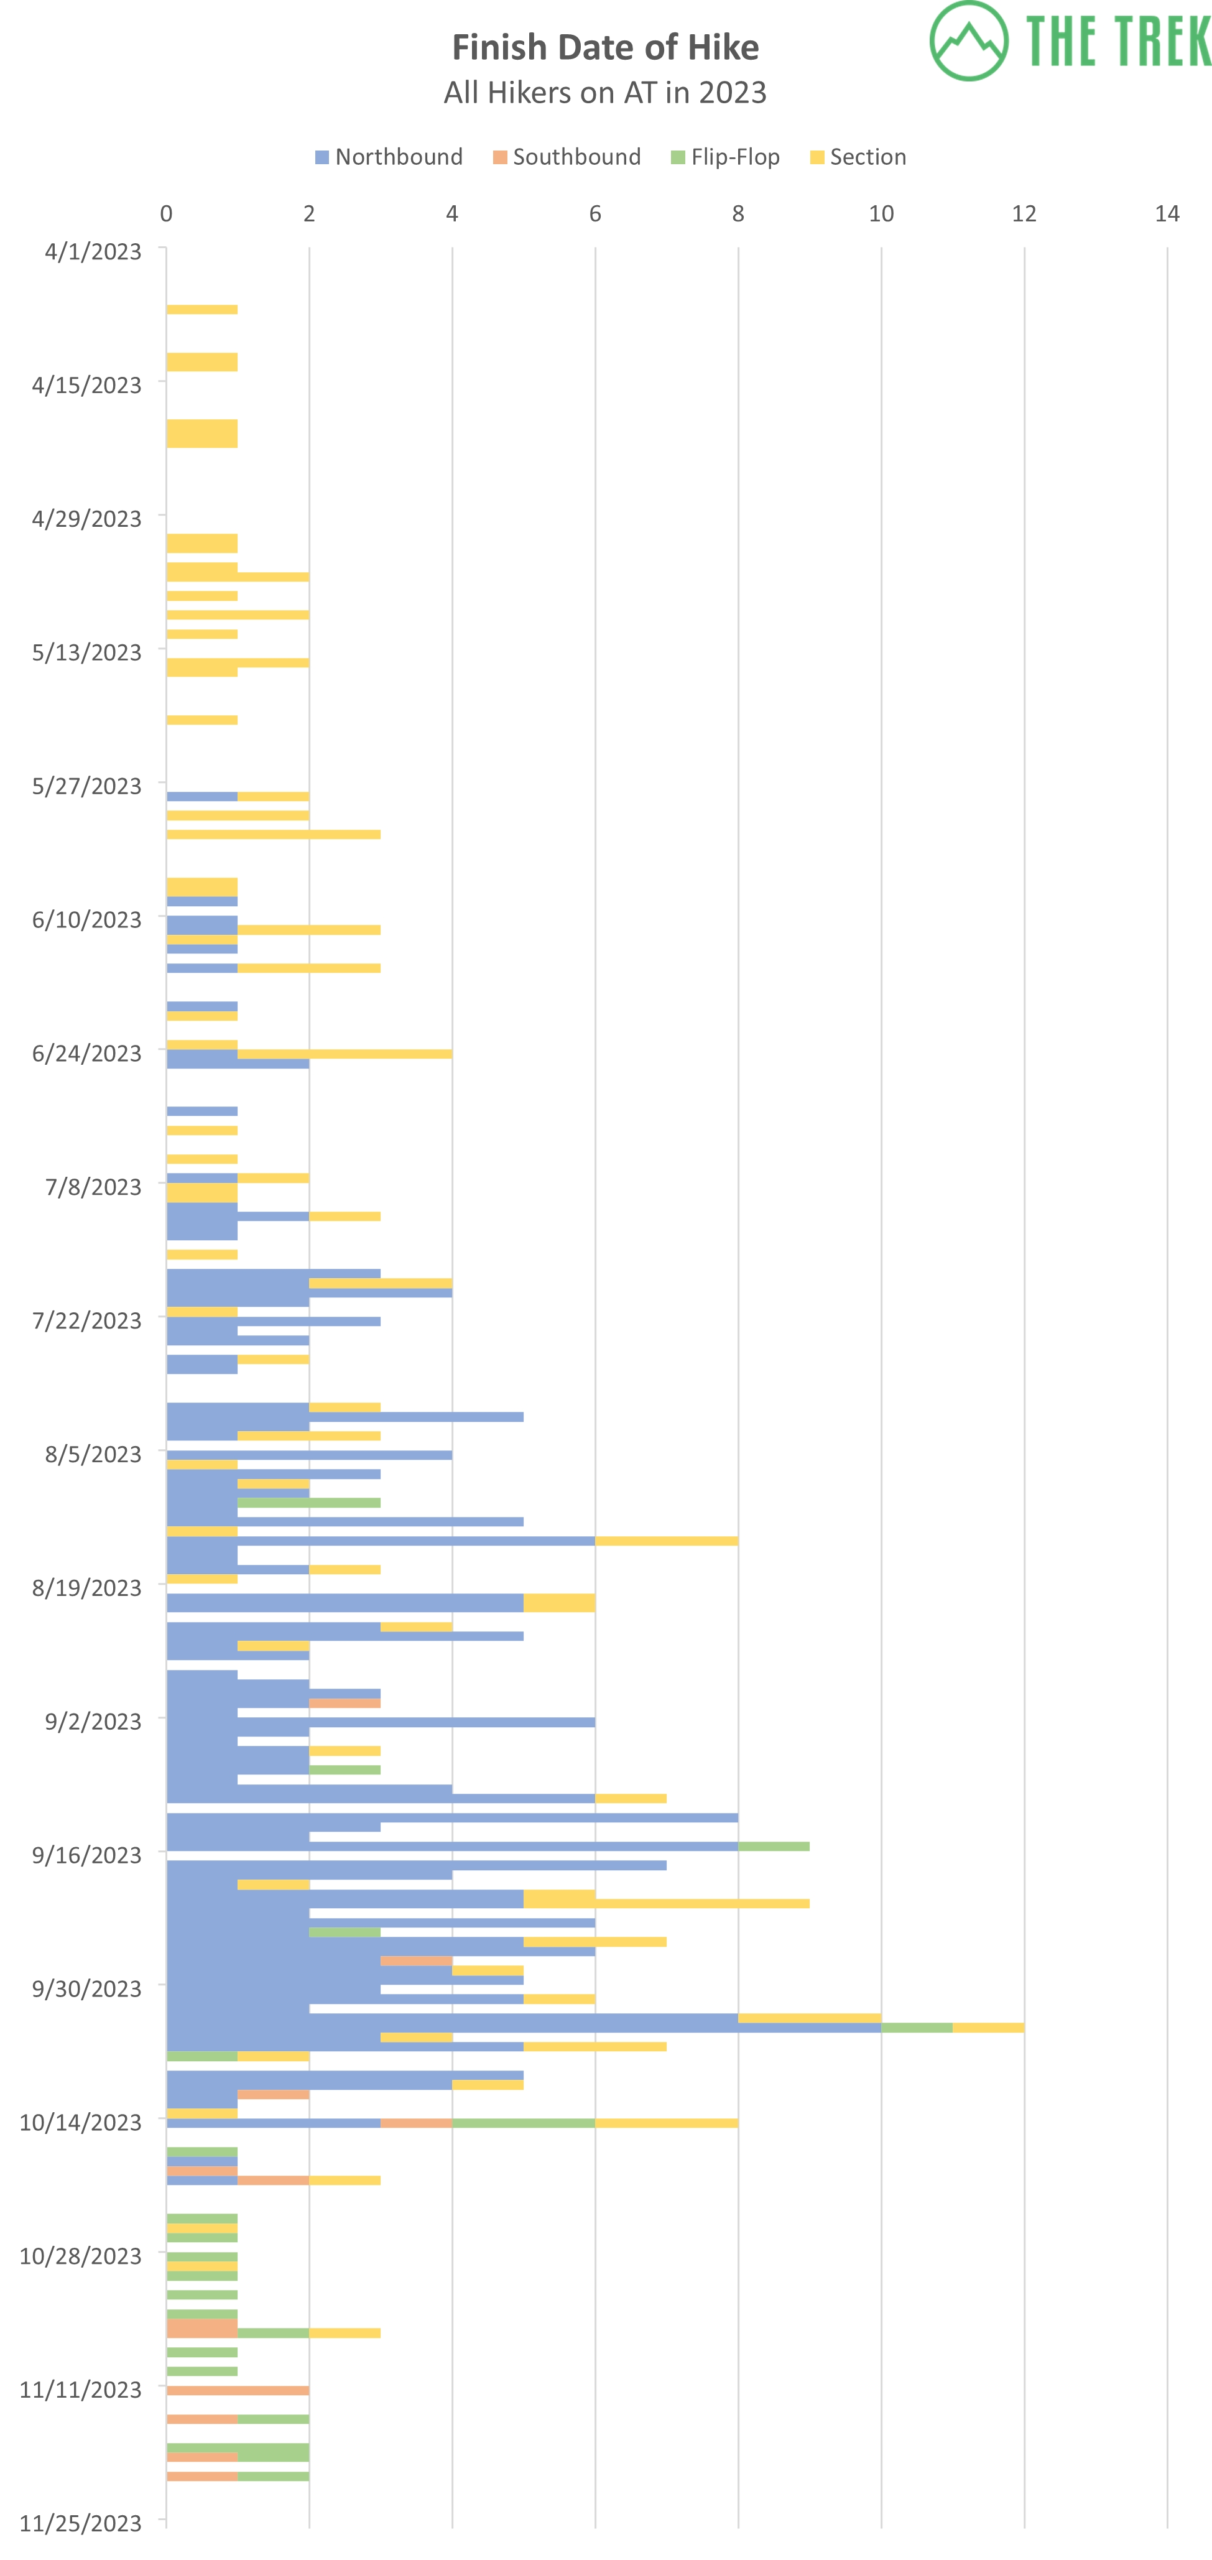
Most hikers finished in September while bleeding into early October. October 3 saw the largest number of hikers finish on any single day. The first Northbound finisher ended on May 28, and the first Southbound finisher was done on August 31. The last Northbound hiker finished their hike on October 20. As of publishing, southbound hikers may still be wrapping up their hikes.
Pace of AT Hikers in Miles Per Day
| Thru-Hikers | Section Hikers | |
|---|---|---|
| Average | 13.6 | 10.5 |
| Median | 13.2 | 10.5 |
| Maximum | 30.1 | 28.5 |
| Minimum | 6.8 | 1.8 |
Festivals and Check-Ins
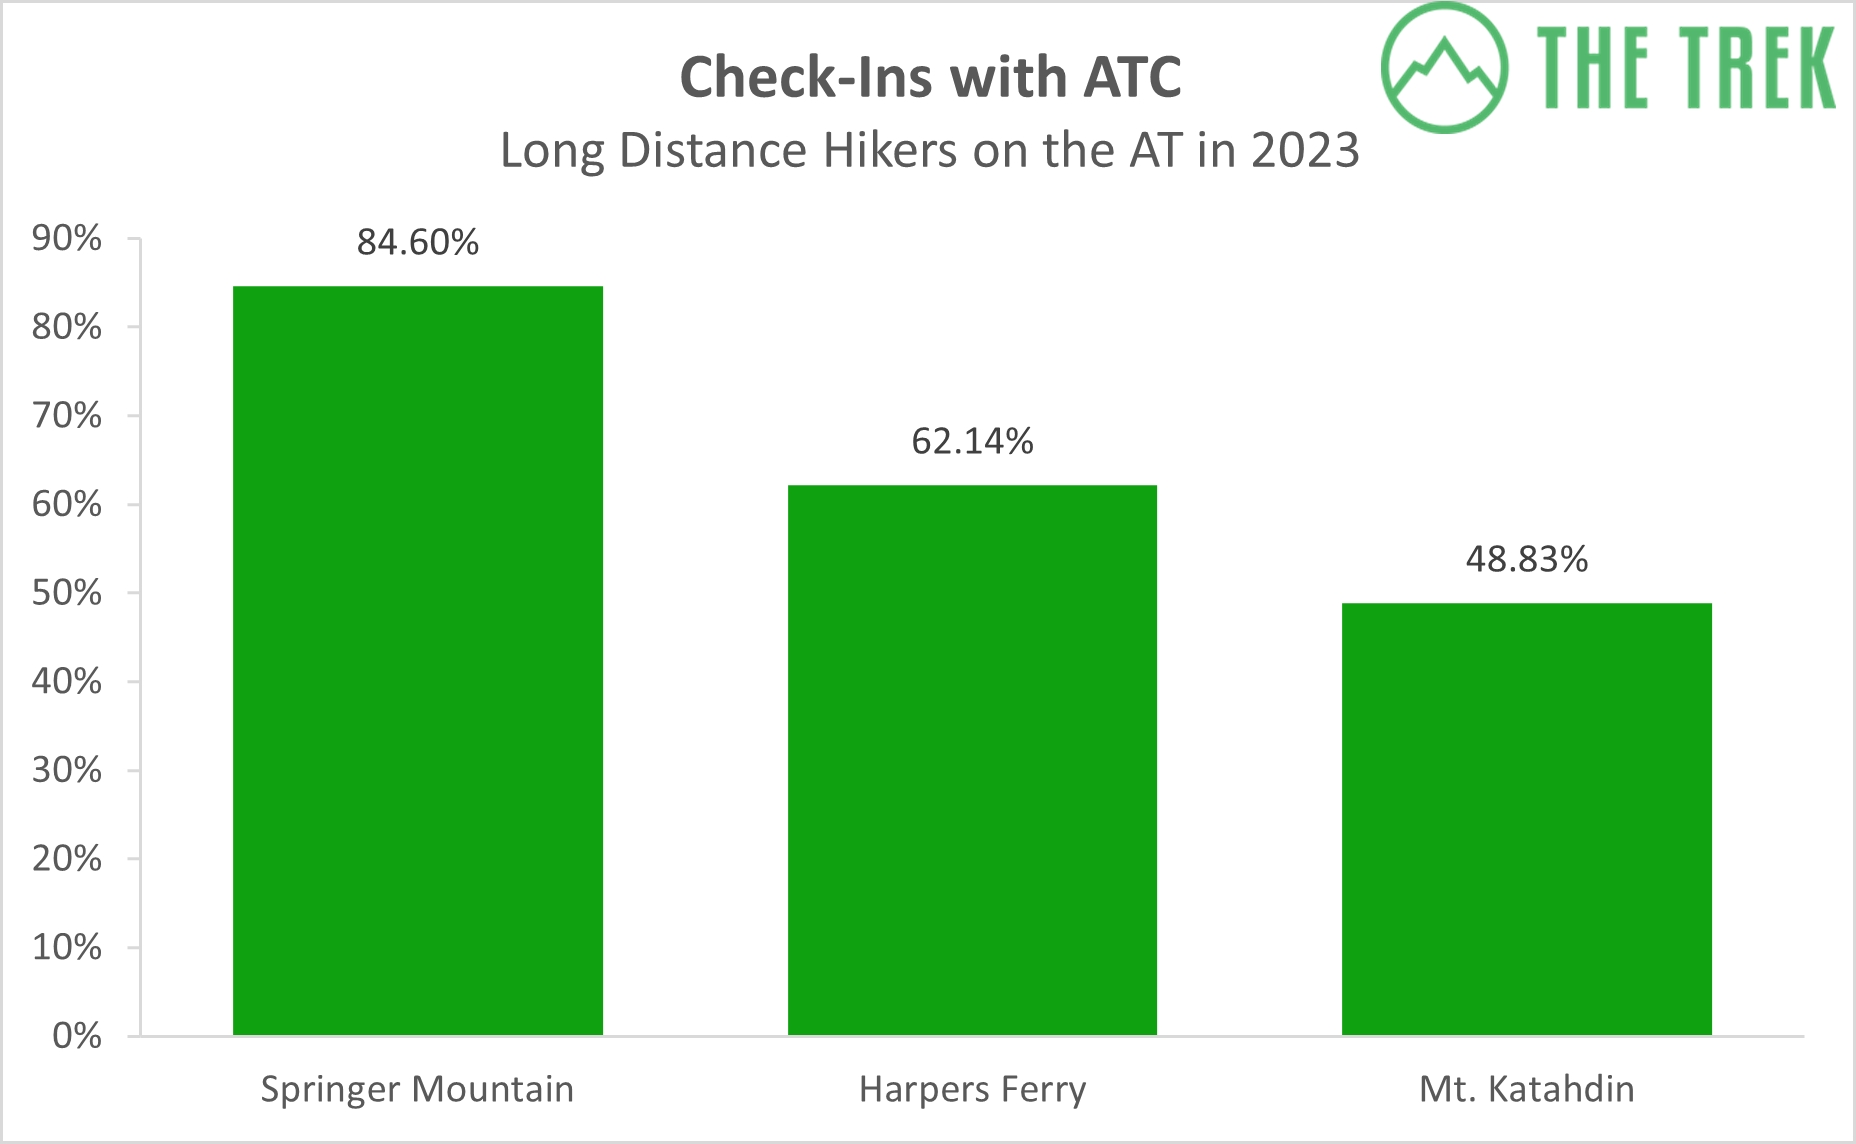
More hikers seem to check in with the ATC every year. Although the Check-ins at Springer and Mount Katahdin were about the same as last year percentage-wise, 6% more hikers checked in at Harpers Ferry this year.
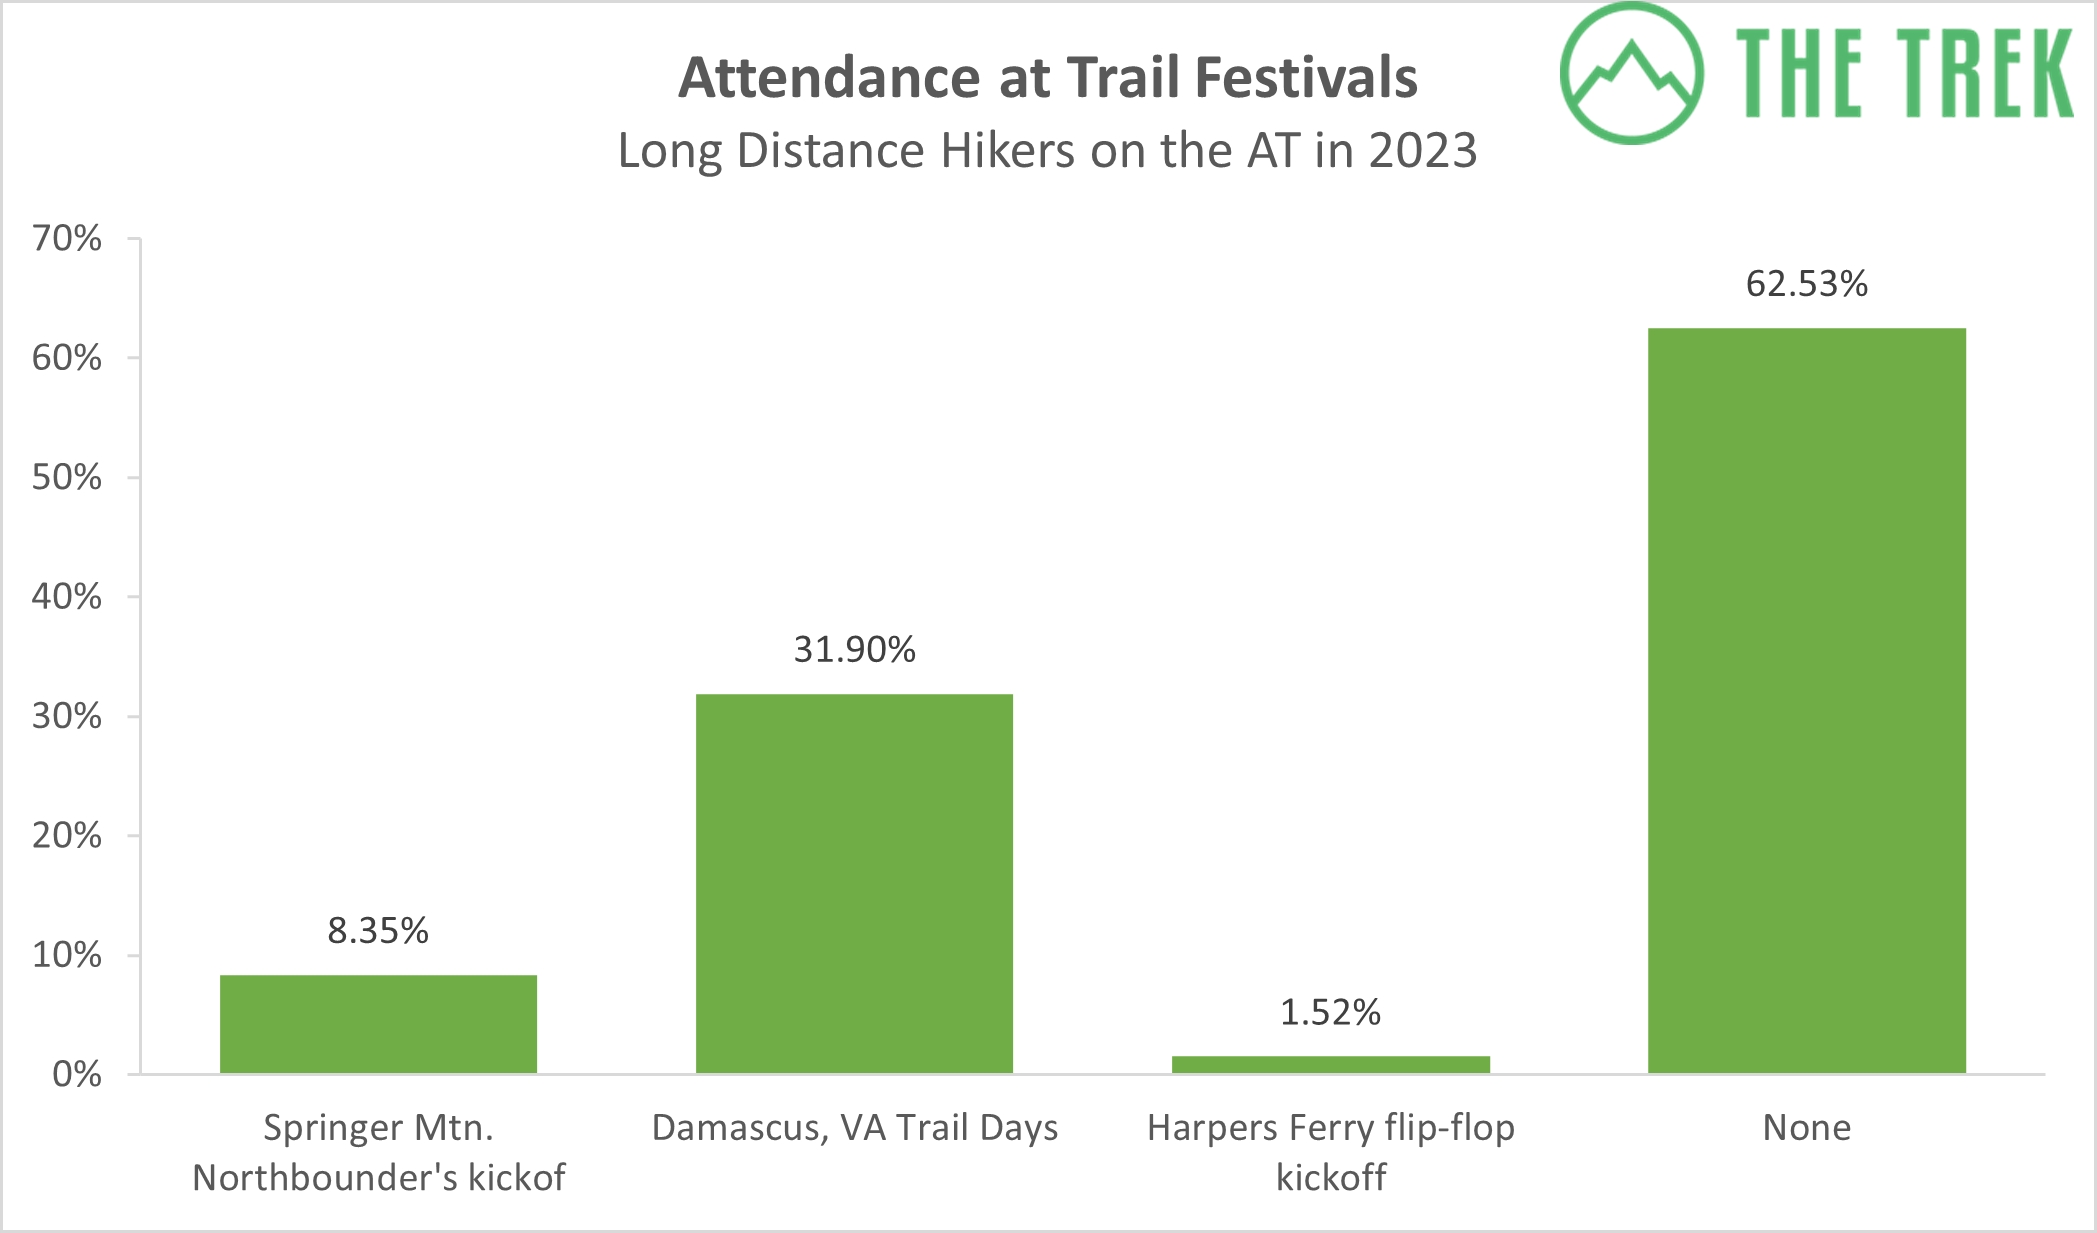
For trail festivals, the attendance was approximately the same as it was last year. Trail Days is clearly the most popular festival and has always been, but most hikers aren’t attending any of the festival options.
Budget
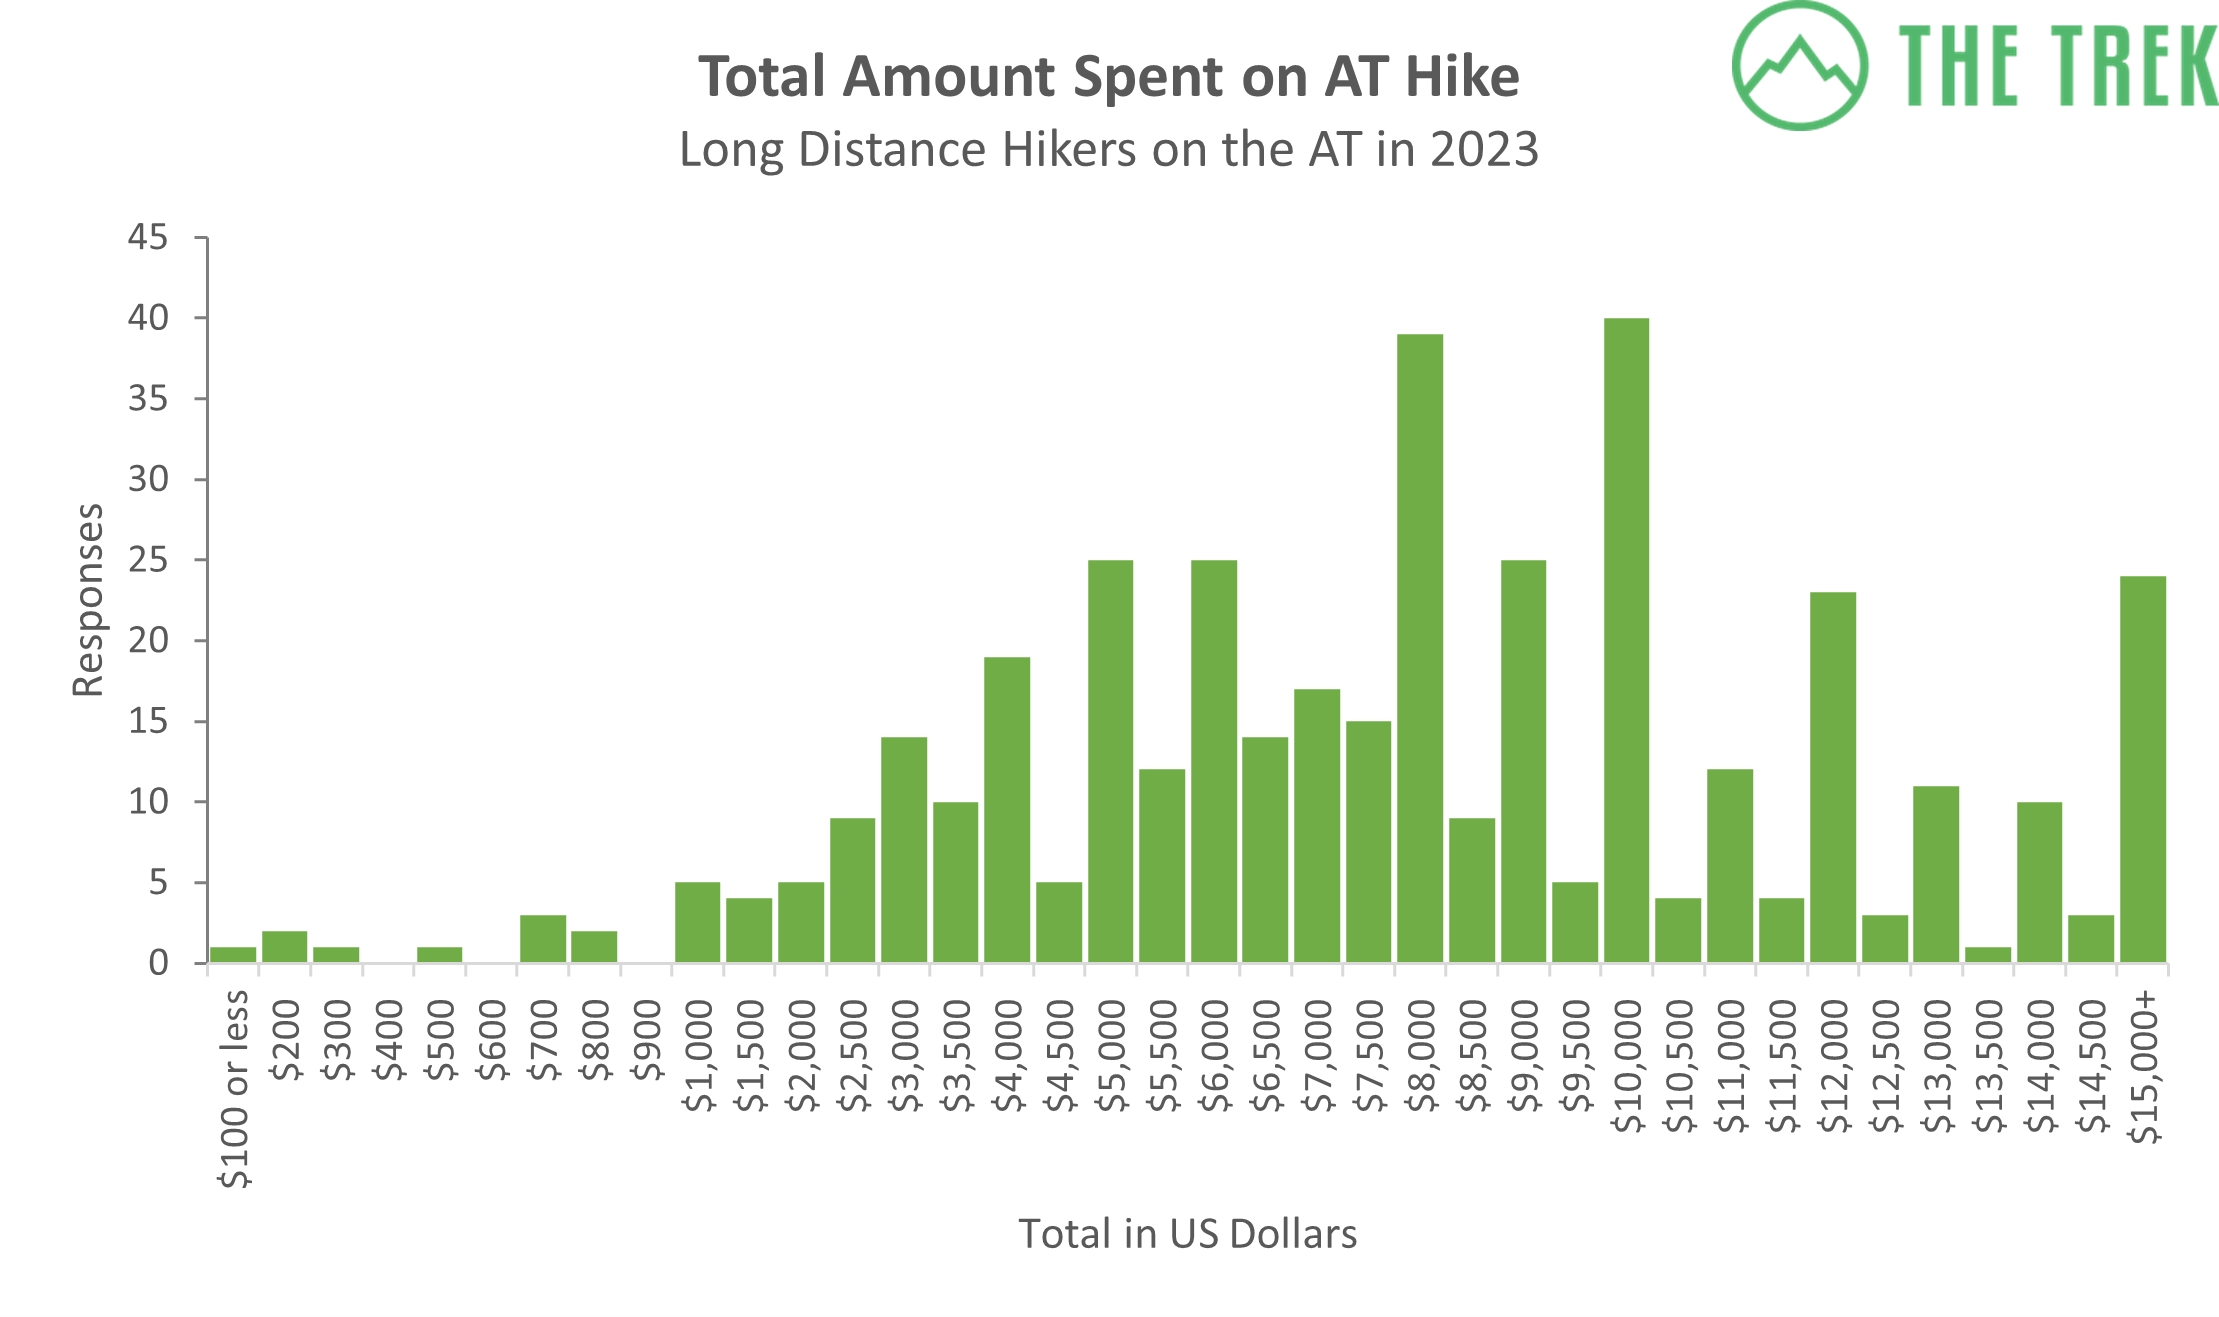
As per usual, the cost of thru-hiking seems to have increased slightly this year with more hikers’ spending approaching the pricey end of the spectrum. The average amount spent this year was $7,482, up over $250 from last year. The most common amount spent was $10,000. It is worth noting that most thru-hikers have only a loose understanding of their budget, and few keep accurate records or tally of their receipts. For this reason, the number of those claiming to have spent $10,000 might be inflated purely because it’s a nice round number.
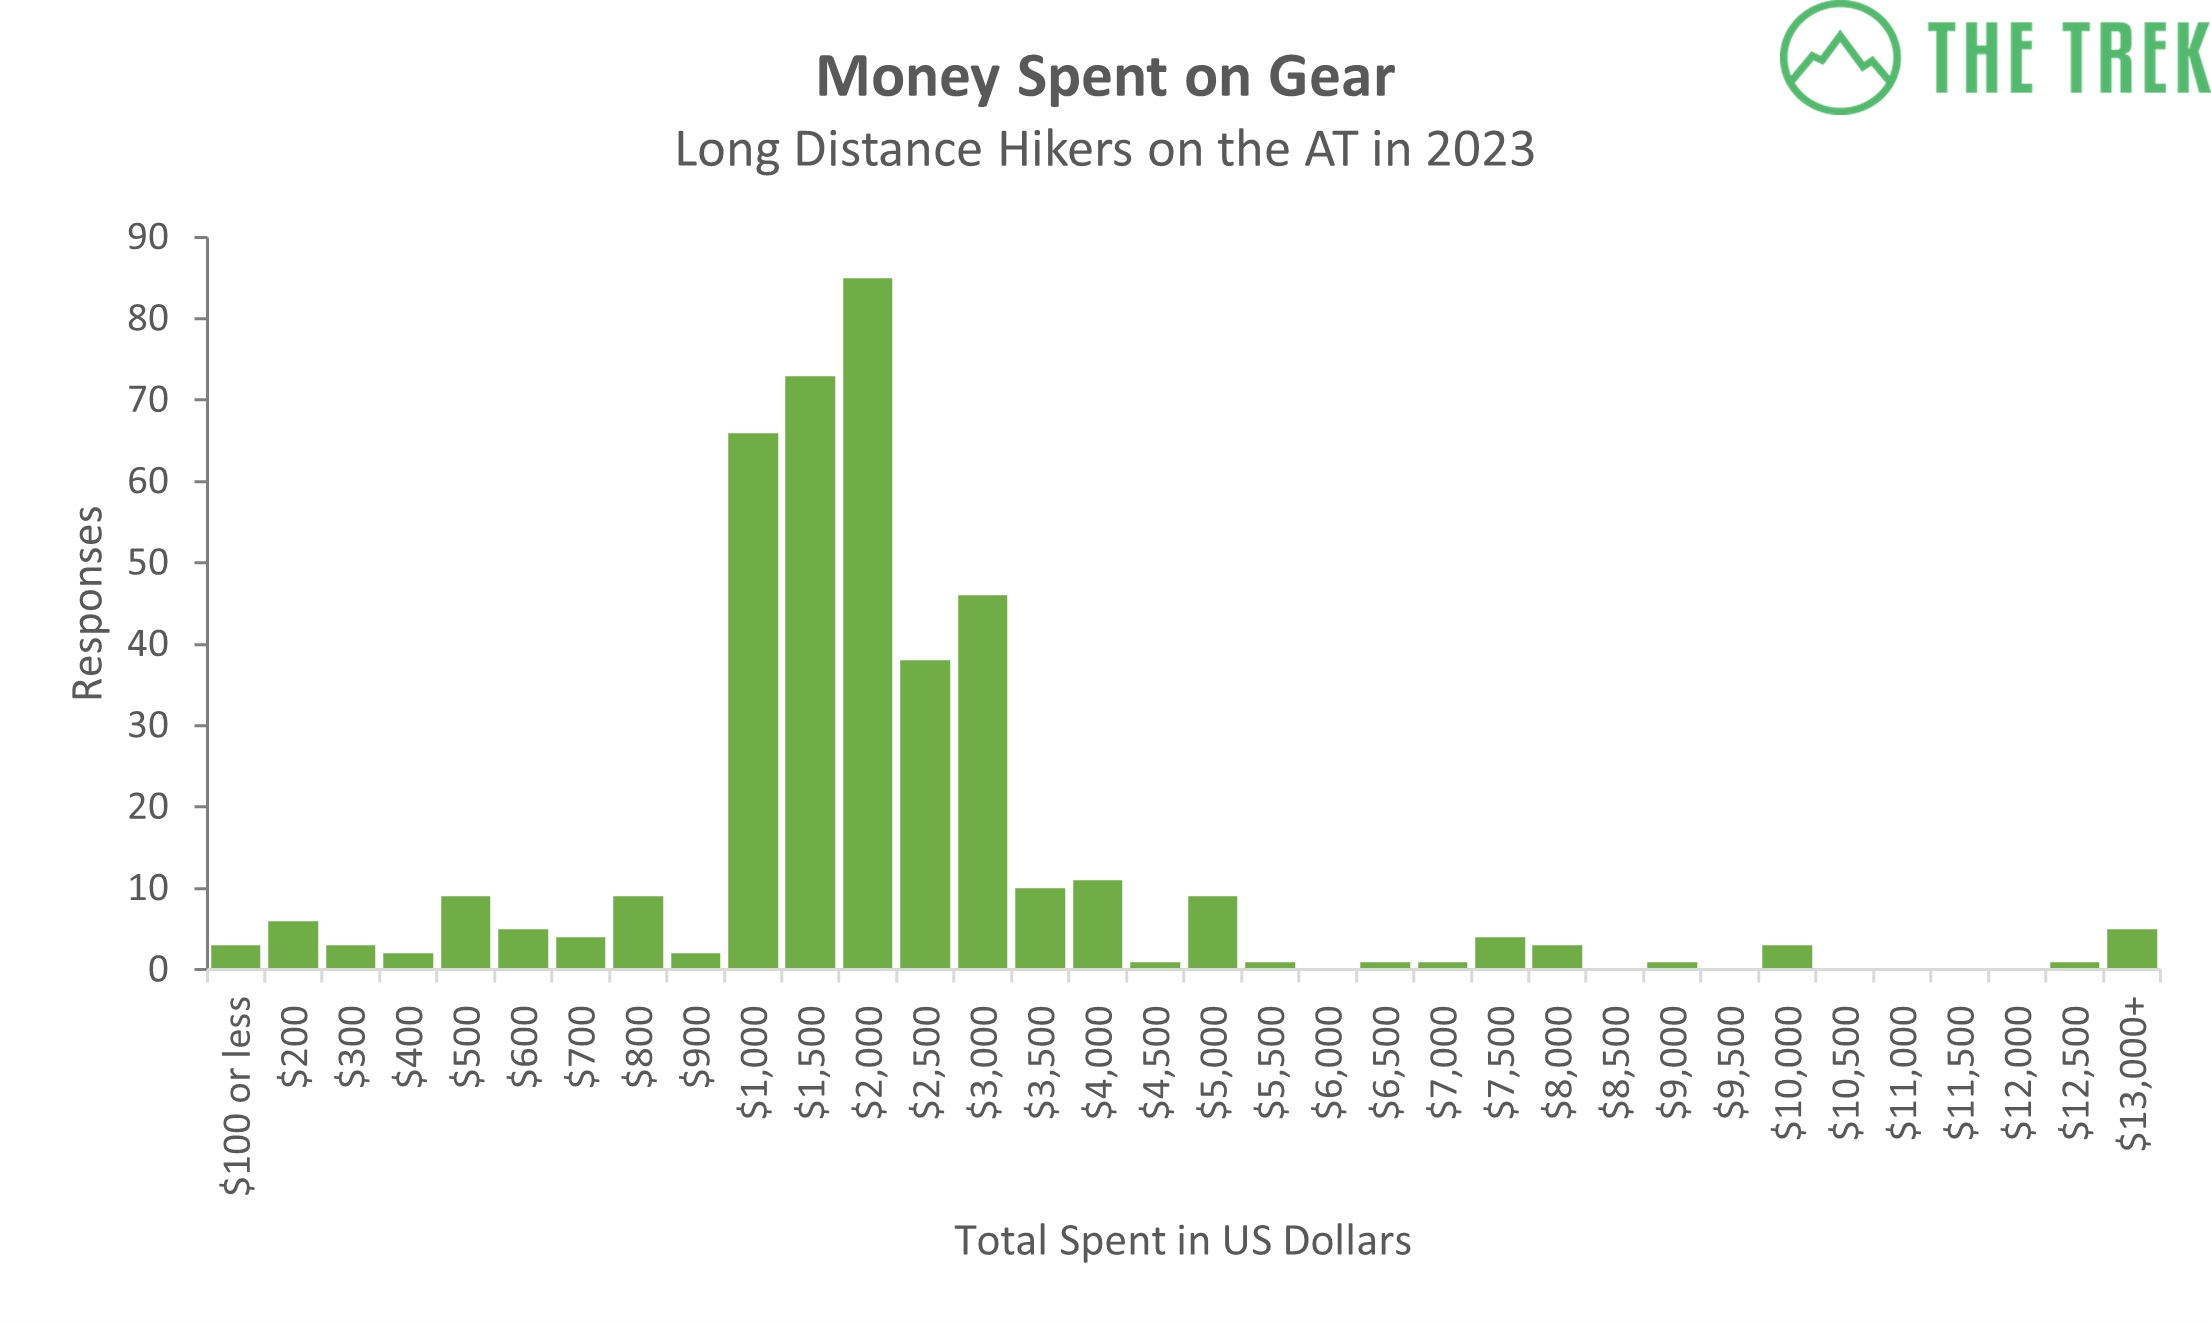
In terms of gear, 75% of hikers spent between $1,000-$3,000 on their gear, about the same as last year. Keep in mind that this includes the initial cost of purchasing gear for the hike, along with the ongoing costs of replacing or repairing shoes, clothing, and gear while hiking.
Conclusion
That’s a wrap on the first post in the AT 2023 Survey series! Up next will be more general information, with a focus on hiker’s experience, safety, and favorites. The following posts will cover backpacks, footwear, shelter systems, sleeping bags, and stoves/filters. Please leave any feedback, questions, or comments in the comment section below. We’d love to hear your thoughts!
To stay up to date on the latest survey posts, make sure to subscribe to our newsletter.
Congratulations to all the AT hikers this year, and a huge thank you to everyone who filled out the survey, we couldn’t do this without you!
Featured image: Graphic design by Chris Helm.

This website contains affiliate links, which means The Trek may receive a percentage of any product or service you purchase using the links in the articles or advertisements. The buyer pays the same price as they would otherwise, and your purchase helps to support The Trek's ongoing goal to serve you quality backpacking advice and information. Thanks for your support!
To learn more, please visit the About This Site page.

Comments 3
Thank you, Kate, I will be headed out on my misadventure this-coming March, and think these compendia are both interesting and useful. Much appreciated, I hope to be able to join in next year following a successful trip!
Sadly it’s a small response back on this survey and a lot of people did fill it out. Minimum age on trail for a Thur-hikers is 7 years old and there were a bunch of Australians out there which the survey didn’t have.